Food Scale vs Measuring Cups: Portion Errors Explained
Compare food scales, measuring cups and eyeballing using portion-size research, practical logging steps and worked calorie examples in kcal and kilojoules.
kcalm editorial team
Prepared with AI assistance
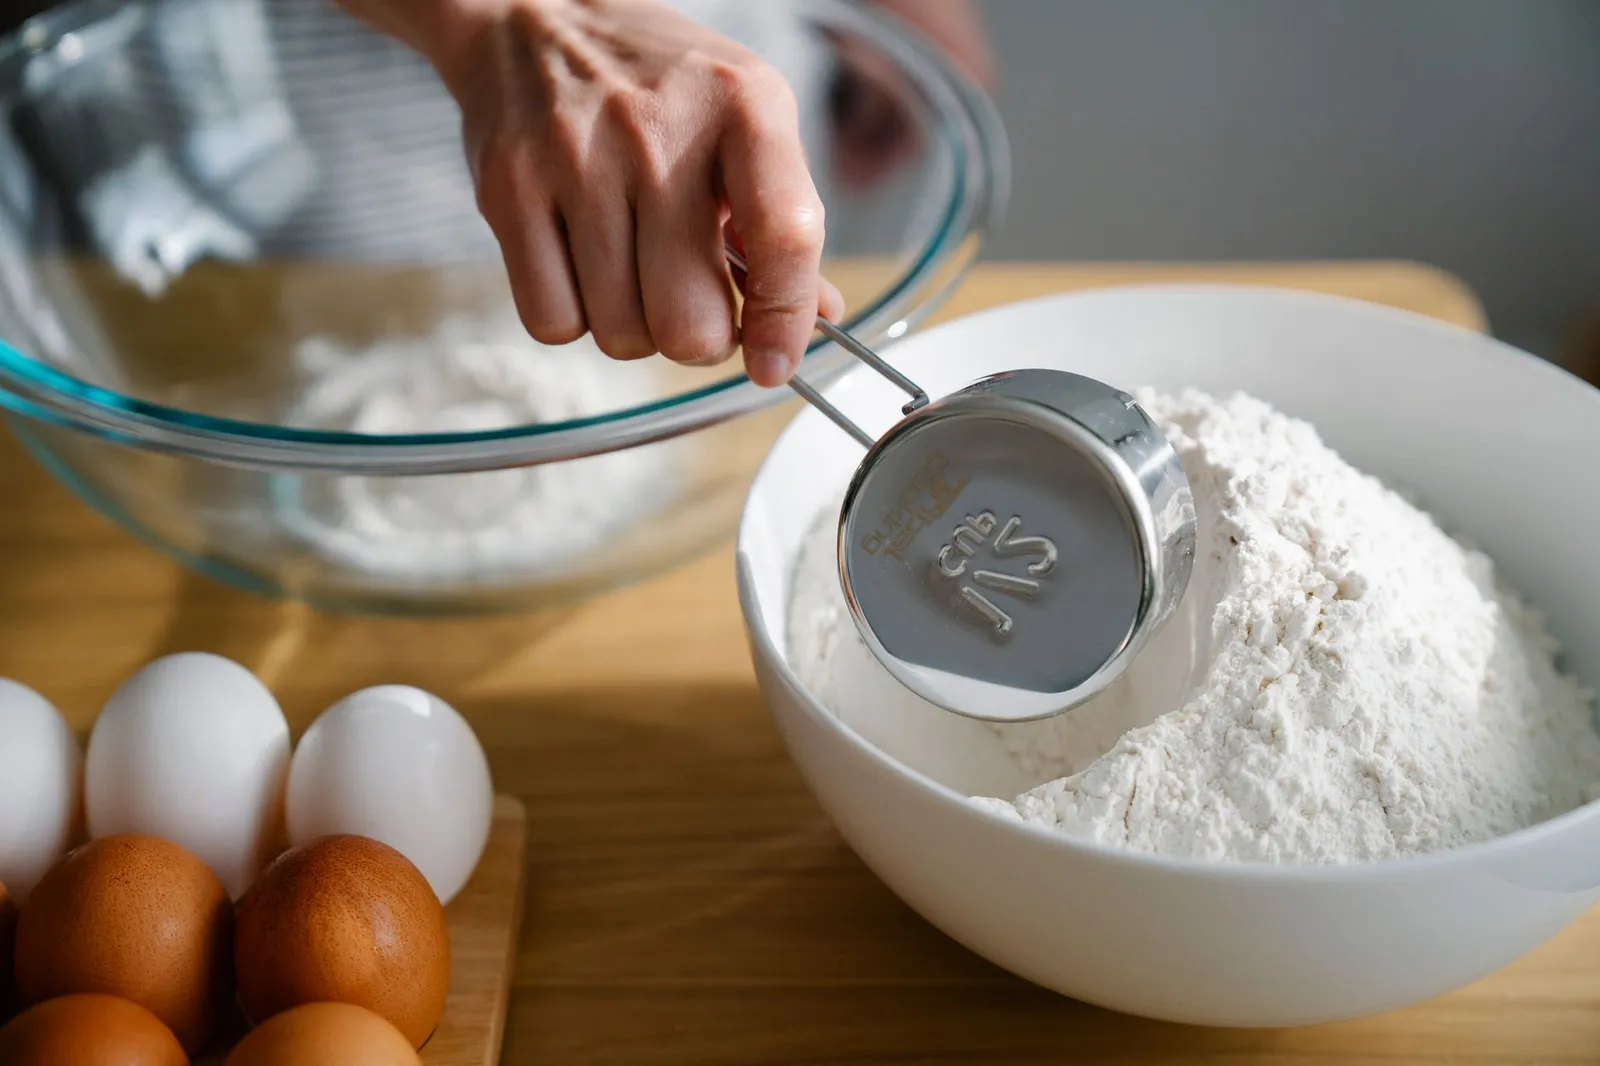
A food scale measures the grams you enter into your food log directly, while measuring cups measure volume and eyeballing estimates a portion from its appearance. Weighing offers a useful reference, but research does not establish a universal error percentage for each method. Your food, technique and database entry all matter. A practical approach is to weigh a few uncertain portions, use familiar measures when convenient, and leave room for estimates [1][2].
Is a food scale more accurate than measuring cups?
A food scale removes the need to convert a guessed volume into grams, which makes it useful for entries listed by weight. Measuring cups remain useful for volume-based entries, but published comparisons distinguish physically measuring food from looking at a cup and estimating how much food would fit inside [1][2].
That distinction changes the answer. In a Newcastle, Australia, experiment involving 128 adults and 17 foods, participants could handle their estimation aid but could not touch the food. The measuring-cup group therefore did not scoop food into cups. Its results describe visual estimation with a reference object, not the accuracy of a carefully filled kitchen measure [2].
A separate study of 120 adults on the island of Ireland let people serve foods using different aids. Scales and measuring jugs produced the narrowest ranges of served weights. However, participants preferred household measures for future use [5]. Precision and convenience can point towards different choices.
For your own log, start with the unit in the entry. A gram-based entry pairs naturally with a scale. A millilitre-based entry pairs with a volume measurement. A generic entry called “one bowl” leaves the bowl size unresolved, however carefully you read the screen.
What does the portion-error research actually show?
Portion-error research shows substantial variation between foods and tasks, rather than a fixed ranking with transferable percentages. The table below reports each study's actual outcome measure, so a percentage describing overestimation is kept separate from the percentage of estimates that met an accuracy threshold [1][2][3][5].
| Method and study | Measured result | What the result means for your log |
|---|---|---|
| Scales and measuring jugs, Irish serving study, 120 adults [5] | Narrowest ranges of served weights among tested aids | Supports precision, but supplies no universal scale error percentage |
| Cup used as a visual aid, Newcastle study [2] | Median relative error +87.7% | Overestimation in this specific task, not error from filling a cup |
| Unaided weight estimation, same Newcastle study [2] | Median relative error +23.5% | Eyeballing was not systematically low in this experiment |
| Finger-width method, Sydney study, 67 adults [1] | Median estimates for 19 of 24 selected food/liquid items were within ±25% | Excludes six irregular meat portions; not a result for every estimate |
| Serving a standard portion, US study, 164 adults [3] | 65% classified as accurate using a ±25% threshold | “Accurate” here still allowed a substantial difference |
The Sydney finger-width method also involved dimensions, geometric formulas and food density factors. It was more involved than calling every fist “one cup”. Its researchers found that irregular shapes posed problems, which limits how confidently you can transfer the results to a chicken breast or fish fillet [1].
The table is an evidence comparison, not a calibration formula. Adding 23.5% to every eyeballed meal, or subtracting 87.7% from cup entries, would misuse those findings. They do not measure your personal habits or validate a particular calorie app.
How much can a portion error change your calorie log?
A portion error changes the logged energy in proportion to the weight error when the food entry and energy per gram stay fixed. For example, logging 40 g when you ate 50 g records 20% less than the actual amount. The calorie difference depends on the food's energy density.
The following are calculated examples using hypothetical label values, not measured averages for brands or results from a feeding trial. Kilojoules use 1 kcal = 4.184 kJ, with final values rounded.
| Example food and assumed label | Logged weight | Actual weight | Energy missing from the entry |
|---|---|---|---|
| Cereal at 400 kcal per 100 g | 40 g | 50 g | 40 kcal / 167 kJ |
| Nut butter at 600 kcal per 100 g | 15 g | 25 g | 60 kcal / 251 kJ |
| Yoghurt at 80 kcal per 100 g | 150 g | 200 g | 40 kcal / 167 kJ |
| Tomato sauce at 100 kcal per 100 g | 20 g | 30 g | 10 kcal / 42 kJ |
For a separate whole-day example, suppose an actual intake of 2,000 kcal (8,368 kJ) is recorded 10% low. The log reads 1,800 kcal (7,531 kJ), a gap of 200 kcal (837 kJ). At 20% low it reads 1,600 kcal (6,694 kJ), a gap of 400 kcal (1,674 kJ). These are scenarios, not error rates assigned to cups or scales.
Notice the denominator: a log that is 20% below actual intake needs a 25% increase to reach that actual value. In the example above, 400 divided by 1,600 is 25%. This is one reason percentage claims can appear contradictory.
You can use the same arithmetic in either direction. An overestimated serving produces a higher entry without changing what you actually ate. A corrected number is information, not a reason to compensate at your next meal.
When are cups, spoons and eyeballing useful?
Cups, spoons and eyeballing are useful when their convenience fits the situation and you treat the result as an estimate. Research on portion aids found that household measures were acceptable to participants, even when direct measurement was more precise [5].
Consider using your usual cereal cup as a personal reference. On one convenient occasion, fill it as you normally do, weigh the contents, and note the grams. Repeat with your usual fill level if you want to see how consistent it is. This is a proposed kitchen exercise, not a validated accuracy guarantee.
Keep that reference tied to the actual food. A cup of cereal flakes and a cup of yoghurt are different entries. Even the phrase “a spoonful” leaves questions about the spoon, the heap and what remains on it. Participants in the Irish study specifically raised heaped versus level measures and sticky residue as practical difficulties [5].
Away from home, a reasonable estimate can be the most workable choice. You might record the meal while it is in front of you and note uncertain components. The aim is a usable record of the meal, not a laboratory measurement at a café table.
For recipes with several ingredients, our homemade meal calorie guide walks through a different problem: distributing a whole recipe across portions. A scale alone does not tell you how the ingredients were distributed between plates.
How can you use a food scale without weighing everything?
You can use a food scale selectively by checking a few recurring portions and matching their weights to the correct food entries. A short, focused check is a practical option when a particular meal feels uncertain; it is not a requirement to measure every meal indefinitely.
- Choose one familiar food. Start with an item you already log, such as breakfast cereal, yoghurt or a spread.
- Place the empty dish on the scale. Use the tare function to set the displayed weight to zero before adding food.
- Serve your usual portion. Record the grams that appear, without changing the serving simply to match an app default.
- Match the entry and unit. Check the food description and whether the entry is per gram, per 100 g, per millilitre or per serving.
- Compare and move on. Update the entry if needed, and decide whether this food benefits from weighing or a familiar household measure next time.
Australian nutrition information panels report average quantities per serving and per 100 g, or per 100 mL for liquids. Food businesses determine their listed serving sizes, which can differ between products [4]. Those columns provide a starting point for the calculation; the listed serving is not automatically the amount on your plate.
For example, if a hypothetical label lists 180 kcal (753 kJ) per 45 g and your portion weighs 60 g, multiply by 60/45. The result is 240 kcal (1,004 kJ). You have changed the amount, not the product's energy density.
Weighing also leaves the food description to resolve. Use our raw versus cooked weighing guide when the entry's preparation state is unclear, and our nutrition label accuracy guide for the separate question of label uncertainty.
Can photo logging replace a food scale?
Photo logging and a food scale supply different information: a photo records appearance, while a scale supplies weight. The portion-estimation studies discussed here do not establish an accuracy percentage for kcalm or demonstrate that photo logging matches a weighed record.
If you use kcalm to start a food log from a photo, consider reviewing the portion estimate and supplying measured grams when you have them. You can combine convenience with an occasional measurement without treating either method as infallible.
The important product claim is the limited one: kcalm offers AI-assisted calorie tracking. This article reports published portion research, not an internal test of kcalm's recognition accuracy. For a broader discussion of logging workflows, see photo versus manual food logging.
Frequently Asked Questions
These frequently asked questions explain how to interpret portion estimates, choose units and keep measurement proportionate to your needs. The answers distinguish logging technique from the much larger question of how much food is appropriate for you.
Is eyeballing always an underestimate?
No. The Newcastle experiment found overestimation on its aggregate signed measure, with results varying across foods [2]. In an older study comparing participants across weight categories, researchers found substantial estimation errors in both groups without a definitive difference between them [6]. Portion error is not a character trait.
Does a food scale guarantee an accurate calorie total?
No. It supplies a weight, while the calorie calculation also depends on the selected food and its listed energy density. In Australian labelling, nutrition panels report average quantities [4]. A precise weight does not turn an average composition value into a direct measurement of your particular meal.
Is being within 25% considered accurate?
It was the operational threshold in the US study of 164 adults, where 65% were accurate for the single-serving task and 62% for the specified-amount task [3]. That is a research definition, not a promise that every app entry is within that range or a target you need to pursue.
Can I use the same cup every day?
Yes, as a consistent personal reference for the same food and filling technique. You can compare it with a weighed portion if useful. Keep the reference descriptive, such as “my usual level cup of this cereal”, rather than assuming it represents the same grams for every food.
Do I need to weigh food at restaurants?
You can estimate restaurant meals. Consider recording the main components and accepting the uncertainty where quantities are unavailable. If detailed measurement makes eating feel stressful, you can simplify the process. Our calorie counting without anxiety guide explores gentler ways to approach a food log.
Sources
These sources include primary portion-estimation studies and Australian government label guidance retrieved for this article on 28 September 2026. The worked calorie examples are calculations, separate from the measured research results.
- Gibson et al. Accuracy of hands v. household measures as portion size estimation aids (2016). Retrieved full text.
- Bucher et al. The international food unit: a new measurement aid that can improve portion size estimation (2017). Retrieved full text.
- Huizinga et al. Literacy, numeracy, and portion-size estimation skills (2009). PubMed abstract.
- Food Standards Australia New Zealand. Nutrition information panels. Government guidance.
- Faulkner et al. An evaluation of portion size estimation aids: precision, ease of use and likelihood of future use (2016). Journal full text.
- Blake et al. Accuracy of food portion estimation by overweight and normal-weight subjects (1989). PubMed abstract.
Ready to track smarter?
Join thousands who use kcalm for calorie tracking. AI-powered food recognition, scientifically-validated calculations, and zero anxiety.
Related Articles
Rowing Calorie Calculator: Watts, Weight and Monitor Math
Estimate rowing calories from watts, pace, body weight and time. Compare Concept2 monitor maths with research and MET values, in kcal and kilojoules.
ScienceSugar Alcohol Calories: What Zero Sugar Costs in Your Log
Zero sugar does not mean zero calories. Sugar alcohols carry anywhere from 0 to 3 kcal (0 to 12.6 kJ) per gram, and the label value depends on where the product was made: the US assigns maltitol 2.1 kcal/g while the EU counts it at 2.4, mannitol swings from 1.6 to 2.4 across the same border, and only erythritol earns a genuine zero in both markets. Australia added allulose to its energy tables in August 2024 at 2 kJ per gram — a fifth of sugar. The full per-gram table in kcal and kJ, why the same protein bar can legally show different calories in three markets, how tracker databases inherit the confusion, and a five-step way to log zero-sugar products accurately.
ScienceStanding Desk Calories: The Real Number Is 9 Per Hour
Standing at your desk burns about 9 extra kcal (38 kJ) per hour compared with sitting — 0.15 kcal per minute for a 65 kg adult, per a meta-analysis of 46 studies and 1,184 participants — roughly one-sixth of the 30-to-50 kcal figure desk vendors advertise. Replacing six hours of sitting with standing adds about 54 kcal a day, while one easy 30-minute lunchtime walk adds roughly the same as standing all afternoon. Where the vendor number goes wrong, the measured MET table for desk tasks, why standing occupations really do double occupational burn, and how to handle standing time in your calorie log.