The Fat-Burning Zone Myth: Fat Percent vs Total Burn
The fat-burning zone on your watch is real physiology, not a fat-loss shortcut. At 60 to 70 percent of maximum heart rate your body draws a higher percentage of fuel from fat, but total energy deficit — not fuel percentage — is what shrinks body fat. Fat oxidation peaks near 64 percent of VO2max and fades above 89 percent, while a 2018 review put peak fat-burning at just 0.2 to 0.5 grams per minute. Why higher intensities burn more total calories, what matched-calorie interval-versus-steady studies found, and how to actually use heart-rate zones.

Sophie Carter
Certified Health Coach & Wellness Writer
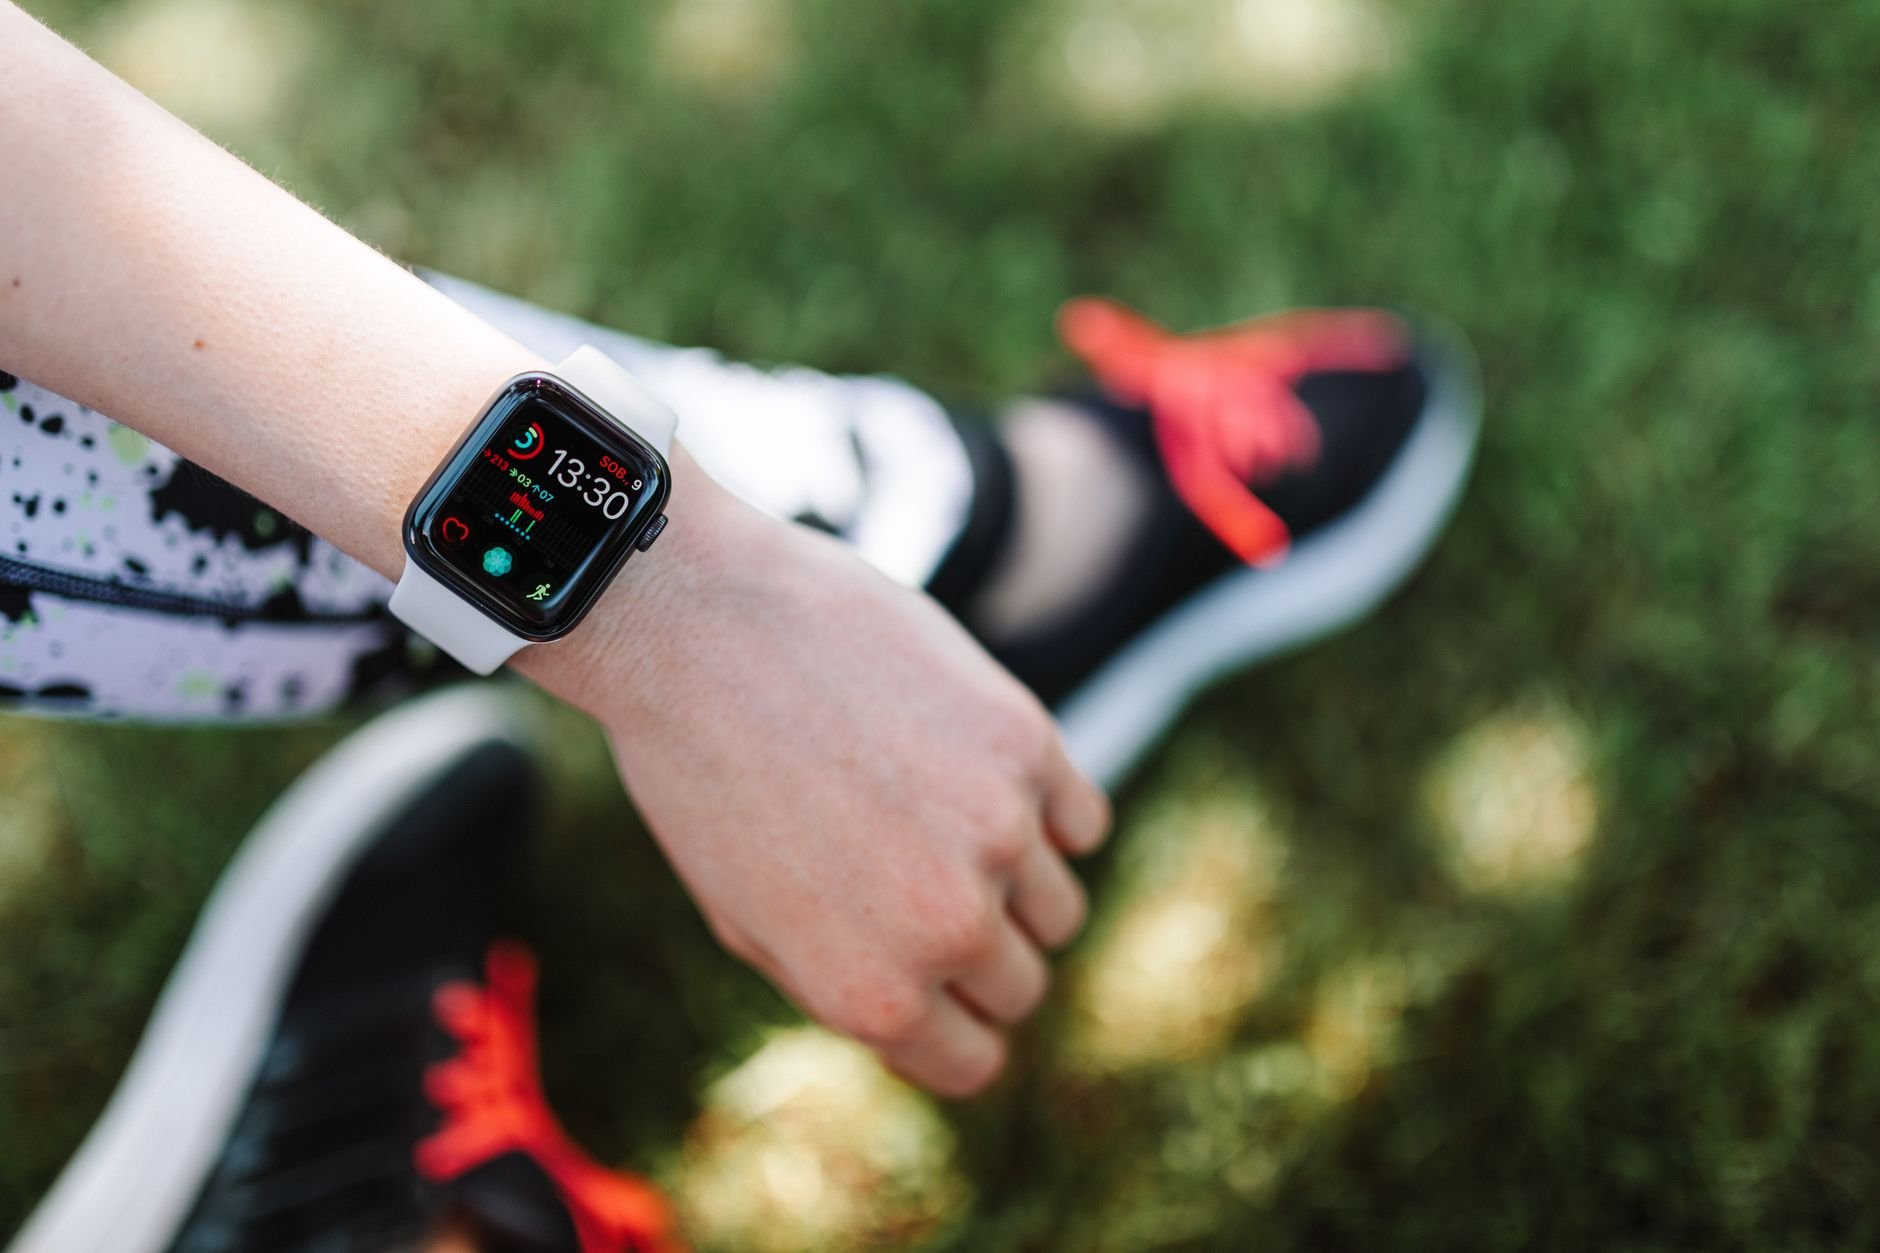
The fat-burning zone is real physiology but a misleading fat-loss target. At a gentle 60 to 70 percent of your maximum heart rate your body does draw a higher percentage of its fuel from fat, but that share is not what shrinks body fat over time — your total energy deficit is. Because harder efforts burn far more total calories per minute, they usually win on fat loss despite drawing a smaller percentage from fat.
Your watch flashes a "fat burn" zone. The treadmill has a "fat burning" program. Both are built on a genuine fact of exercise physiology: at easier efforts, a larger slice of the energy you spend comes from fat rather than carbohydrate. The problem is the story people attach to that fact — that staying in the zone is the fast lane to losing body fat. It is not. The percentage of fuel that is fat and the amount of body fat you lose are two different things, and confusing them can quietly steer your training in the wrong direction.
This guide separates the two. It walks through where the zone comes from, what the strongest exercise-physiology data say about fat oxidation, why a higher fat percentage does not translate into more fat loss, and how to actually use the heart-rate zones on your watch. Every figure is grounded in a primary source — peer-reviewed metabolic studies and a large fat-oxidation review — listed at the end. If you track your training burn as well, it pairs naturally with the MET calorie calculator.
What is the fat-burning zone, and is it real?
The fat-burning zone is the low-to-moderate effort — roughly 60 to 70 percent of maximum heart rate — where fat supplies its largest share of energy. It is real: fat oxidation peaks near 64 percent of VO2max and fades to almost nothing above about 89 percent. The label is accurate; the fat-loss promise attached to it is not.
The physiology is well established. As exercise intensity climbs, your body shifts fuel: fat oxidation rises from low intensities, peaks somewhere in the middle, then falls steeply as carbohydrate takes over. Exercise scientists call this shift the "crossover" concept — the point at which glucose overtakes fat as the dominant fuel. The intensity where fat burning is highest has a name, Fatmax, and a foundational cycling study placed it at about 64 percent of VO2max (around 74 percent of maximum heart rate), with the surrounding zone spanning roughly 55 to 72 percent of VO2max. Above about 89 percent of VO2max, fat's contribution becomes negligible.
So the zone exists. What surprises most people is how little fat is being oxidised even at the peak. A 2018 review of maximal fat oxidation across many studies put typical peak rates at just 0.2 to 0.5 grams per minute, varying by fitness and body composition.
Those peak rates translate into small numbers over a whole session. Here is what the 2018 review reported for peak fat oxidation and the intensity at which it occurred, by group.
| Group | Fatmax (% VO2max) | Peak fat oxidation |
|---|---|---|
| Endurance-trained men | 56% | 0.53 g/min |
| Recreationally active men | 51% | 0.46 g/min |
| Recreationally active women | 50% | 0.35 g/min |
| Adults with overweight or obesity | 43–61% | 0.16–0.28 g/min |
Does burning a higher percent of fat mean losing more body fat?
No. The share of fuel you burn as fat during a workout does not decide how much body fat you lose — your overall calorie balance does. Approaches that raise fat oxidation mid-session, such as training fasted, do not reliably produce more long-term fat loss, because what you burn during exercise is only one line in a 24-hour ledger.
This is the crux of the myth. Fat burned during a workout and fat lost from your body are linked only through total energy balance over days and weeks. If you burn a higher percentage of fat during exercise but eat back the difference, or if your body simply burns proportionally more carbohydrate later in the day, the net effect on your fat stores washes out. Your body manages its fuel mix across 24 hours, not one session.
The clearest evidence comes from fasted-exercise research. Training before breakfast does increase the proportion of fat you burn during the session — but a study measuring fat metabolism at 45, 65, and 85 percent of VO2max after a fast concluded plainly that "fasting before exercise may be used to increase the proportion of fat metabolism and to lose weight, but the effect is not obvious in the long term." Higher fat oxidation in the moment did not become more body fat lost over time.
There are three reasons the fat-percentage number misleads:
- Percentage is not amount. A high fat percentage of a small total can be fewer fat grams than a lower percentage of a much larger total, as the numbers in the next section show.
- The body balances fuel over 24 hours. Burn more carbohydrate now and your body tends to burn more fat later, and vice versa, so a single session's fuel mix does not set your daily fat balance.
- Measurement is noisy anyway. The 2018 review found day-to-day variability in fat-oxidation measures with coefficients of variation from around 3 percent up to more than 15 percent, so even the number itself is an estimate, not a fixed readout.
The practical upshot: chasing a fat-burning readout is optimising the wrong variable. The variable that drives fat loss is the calorie deficit you hold across the week, whatever fuel mix produced it.
Which intensity burns the most total calories?
Higher intensities burn the most total calories per minute, and total calories create the deficit. A hard run can burn two to three times an easy walk's calories in the same half hour, plus a modest afterburn — in one study of men with obesity, interval running produced about 66 kcal of post-exercise burn versus 54 kcal for steady running.
Because total energy expenditure is what matters, intensity helps rather than hurts fat loss — even though it lowers the fat percentage. Harder efforts move far more total energy per minute, so the absolute fat burned often holds up while the calorie total climbs. The afterburn, or excess post-exercise oxygen consumption (EPOC), adds a little more: in the interval-running study, total post-exercise energy came to about 66 kcal after intervals versus 54 kcal after continuous running, and the interval session burned slightly more overall (about 370 versus 346 kcal) in less time.
The table below is an illustrative worked example for a 70 kg (154 lb) adult over 30 minutes, combining typical total-calorie burn with typical substrate percentages. Treat the fat-gram column as an estimate — it shows the shape, not a precise measurement.
| Effort (heart-rate zone) | Total kcal (30 min) | Approx. kJ | Est. % from fat | Fat burned |
|---|---|---|---|---|
| Easy walk (Zone 1) | ~110 | ~460 | ~60% | ~7 g |
| Brisk pace / Fatmax (Zone 2) | ~220 | ~920 | ~45% | ~11 g |
| Steady run (Zone 3) | ~290 | ~1,215 | ~30% | ~10 g |
| Hard run (Zone 4) | ~400 | ~1,675 | ~15% | ~7 g |
| Near-maximal (Zone 5) | ~515 | ~2,155 | ~5% | ~3 g |

Does that mean high intensity is always better? Not quite. When researchers match training programmes fairly, the differences in fat loss are small. A 2023 meta-analysis of 29 studies and 807 adults comparing high-intensity interval training with moderate-intensity continuous training found only modest between-group differences — about a 0.48 percent greater reduction in body-fat percentage and a 0.96 cm greater waist reduction favouring intervals, while total body weight and fat mass did not differ significantly. In other words, both work, and the "best" intensity is largely the one you will keep doing. That echoes the wider cardio-versus-strength picture: adherence and total energy expenditure beat any single magic zone.
How should you use heart-rate zones on your watch?
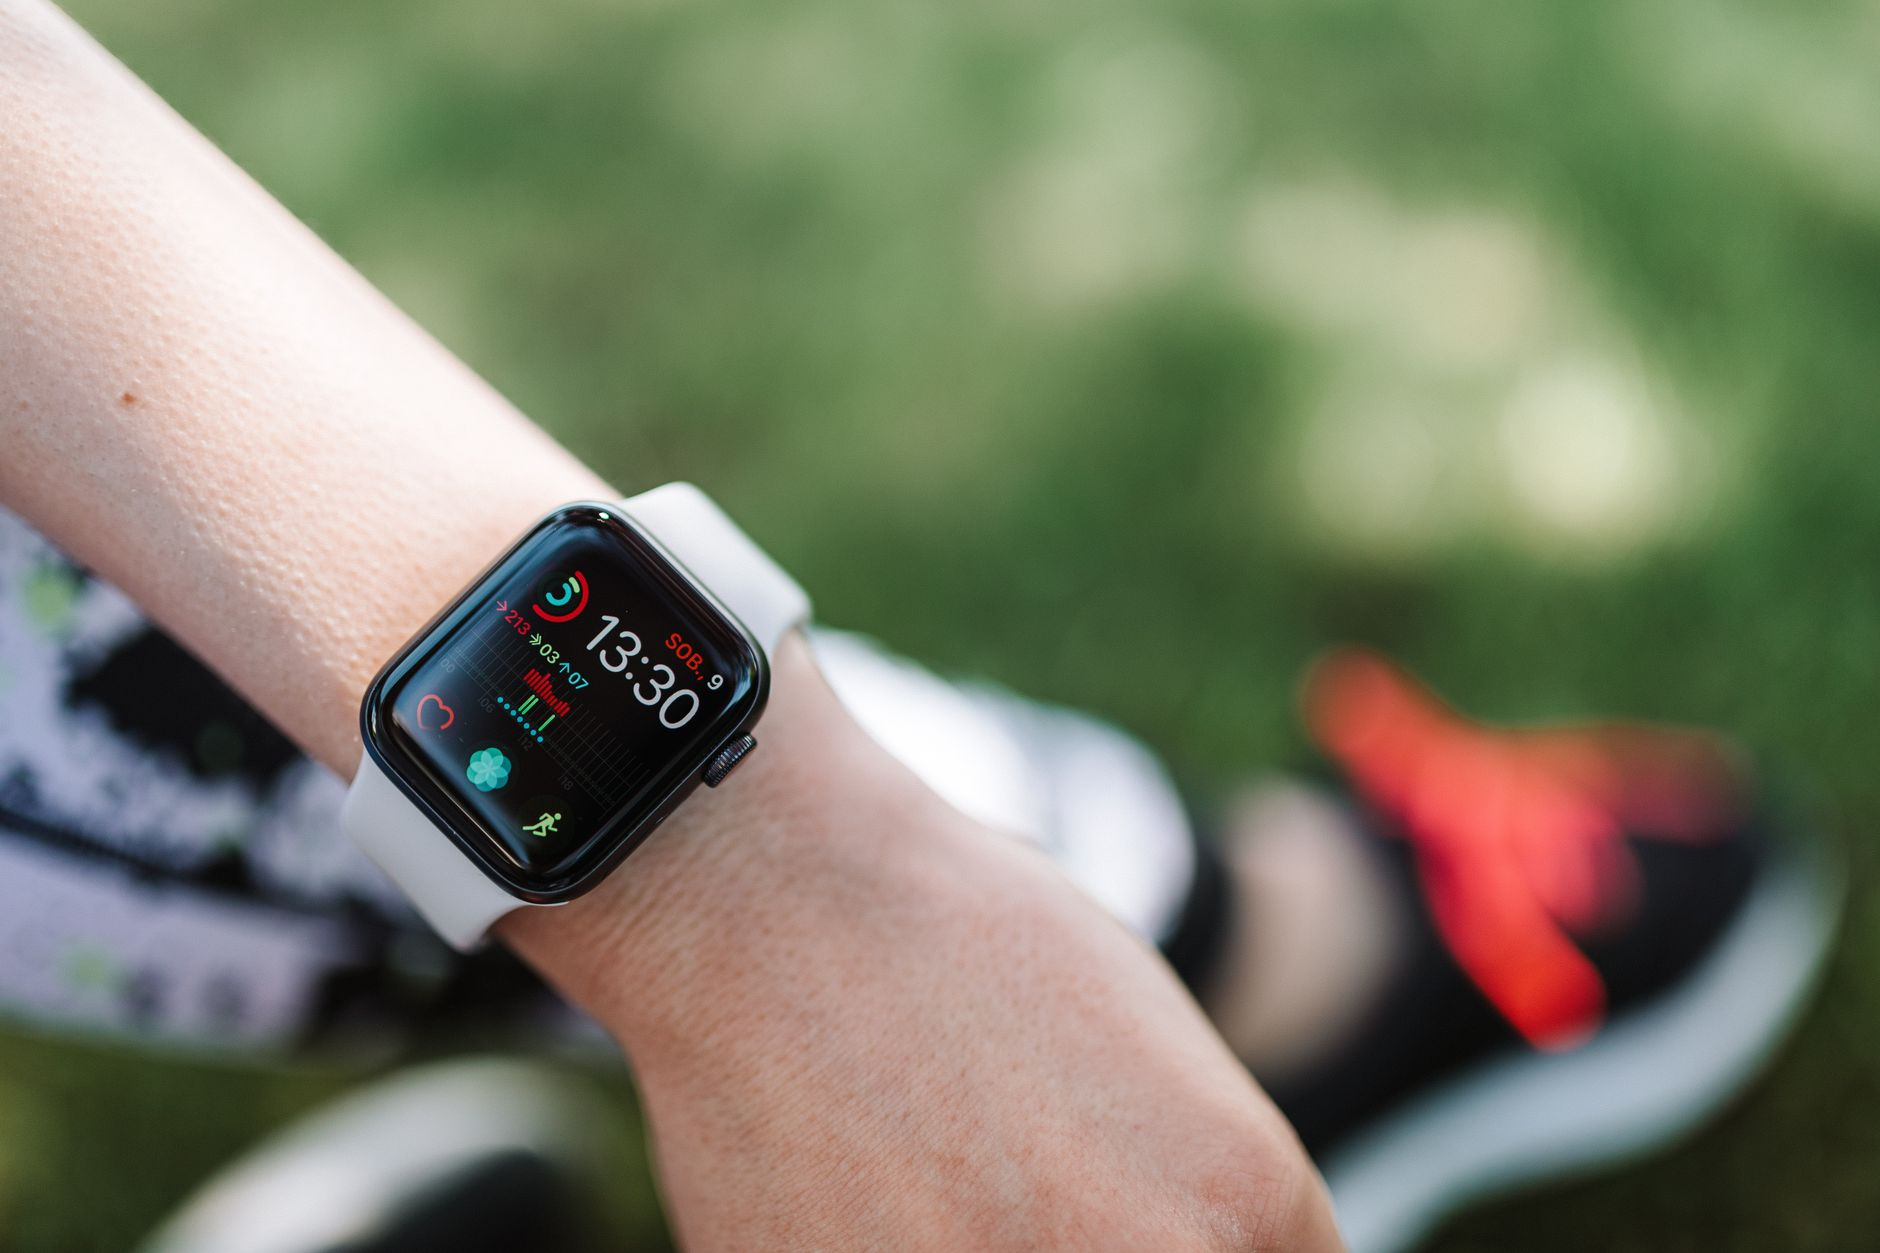
Use zones to manage effort and recovery, not to chase a fat-burning readout. Your watch estimates rather than measures the fat you burn, and its zone labels usually rest on the 220-minus-age formula, which is only an approximation. Pick an intensity you can sustain and enjoy, keep your total movement high, and let your food log drive the deficit.
Heart-rate zones are genuinely useful — for pacing, for building an aerobic base, for knowing when you are pushing too hard to recover. What they are not is a fat-loss dial. The "fat burn" label is a proportion, not a promise, and the zone boundaries on most watches come from the rough 220-minus-age maximum-heart-rate estimate, which can be off by 10 to 20 beats per minute for an individual. Your device is layering an estimate (fat percentage) on top of an estimate (your true max), then presenting it as a precise target.
Here is a practical way to use zones without falling for the myth:
- Set the deficit with food first. Fat loss is driven by your weekly energy balance; training supports it but rarely outruns the kitchen, so anchor the plan in your calorie tracking.
- Spend most easy sessions in Zones 1 to 2. Low intensity is sustainable, low-injury, and lets you accumulate lots of total movement — good for base fitness and daily calorie burn.
- Add some higher-intensity work if you enjoy it. Harder efforts pack more total calories and a small afterburn into less time; a couple of sessions a week is plenty.
- Judge sessions by total energy and consistency, not fat percentage. The number that matters is calories over the week, so read the trend, not the "fat burn" gauge.
- Treat the watch's calorie figure as an estimate. Wearables can misjudge energy expenditure substantially, so use it as a rough guide and cross-check with your wearable and nutrition tracking habits rather than a source of truth.
None of this means low-intensity exercise is a waste — far from it. Easy Zone 2 work is sustainable, protects your joints, builds the aerobic base that lets you do more overall, and burns real calories. The point is simply that it earns its place through total energy and consistency, not through a fuel percentage. Choose the effort you will repeat, keep moving often, and let the weekly picture — training plus food — do the work.
Frequently Asked Questions
Is the fat-burning zone a myth?
Not entirely. The zone is real physiology: at roughly 60 to 70 percent of maximum heart rate, a higher percentage of your energy comes from fat, and fat oxidation peaks near 64 percent of VO2max. What is a myth is the idea that staying in it maximises fat loss. Total calories burned, set against your food intake, drives body-fat change — not the fuel percentage during any one session.
Do you burn more fat at lower intensity?
You burn a higher percentage of fat at lower intensity, but often fewer total fat grams than at moderate intensity, and far fewer total calories than at high intensity. A 2018 review put peak fat oxidation at only about 0.2 to 0.5 grams per minute. Because harder efforts spend much more total energy, they usually match or beat easy efforts for fat loss over time.
Should I stay in Zone 2 to lose weight?
Zone 2 is excellent for building aerobic fitness with low injury risk, and it burns real calories, so it can absolutely be part of a fat-loss plan. But it is not required for fat loss. When researchers matched training fairly, a 2023 meta-analysis of 807 adults found only small differences between interval and steady-state training. The best intensity is the one you will do consistently.
Does exercising fasted burn more fat?
Fasted exercise does raise the proportion of fat you burn during the session. However, a study measuring fat metabolism after a fast concluded the long-term weight-loss effect is "not obvious," because what you burn mid-session is only one part of a 24-hour energy balance. Fasted training is a personal-preference choice, not a fat-loss shortcut.
Is the fat-burn number on my watch accurate?
Treat it as a rough estimate. Watches infer fat burn from heart rate and motion, and their zone boundaries usually rest on the 220-minus-age maximum-heart-rate formula, which can be off by 10 to 20 beats per minute for an individual. Wearables can also misjudge total energy expenditure substantially, so use the figure as a guide rather than a precise measurement.
Sources
- Maunder E, Plews DJ, Kilding AE. Contextualising Maximal Fat Oxidation During Exercise: Determinants and Normative Values. Front Physiol. 2018. https://pmc.ncbi.nlm.nih.gov/articles/PMC5974542/
- Zhang H, et al. Effect of High-Intensity Interval Training vs. Moderate-Intensity Continuous Training on Fat Loss and Cardiorespiratory Fitness in the Young and Middle-Aged: a Systematic Review and Meta-Analysis. 2023. https://pmc.ncbi.nlm.nih.gov/articles/PMC10048683/
- Acute interval running induces greater excess post-exercise oxygen consumption and lipid oxidation than isocaloric continuous running in men with obesity. 2024. https://pmc.ncbi.nlm.nih.gov/articles/PMC11035584/
- Effects of Low/Medium-Intensity Exercise on Fat Metabolism after a 6-h Fast. 2022. https://pmc.ncbi.nlm.nih.gov/articles/PMC9736603/
- Cleveland Clinic. What Is Your Fat-Burning Heart Rate? Health Essentials. https://health.clevelandclinic.org/fat-burning-heart-rate
Ready to track smarter?
Join thousands who use kcalm for calorie tracking. AI-powered food recognition, scientifically-validated calculations, and zero anxiety.
Related Articles
Standing Desk Calories: The Real Number Is 9 Per Hour
Standing at your desk burns about 9 extra kcal (38 kJ) per hour compared with sitting — 0.15 kcal per minute for a 65 kg adult, per a meta-analysis of 46 studies and 1,184 participants — roughly one-sixth of the 30-to-50 kcal figure desk vendors advertise. Replacing six hours of sitting with standing adds about 54 kcal a day, while one easy 30-minute lunchtime walk adds roughly the same as standing all afternoon. Where the vendor number goes wrong, the measured MET table for desk tasks, why standing occupations really do double occupational burn, and how to handle standing time in your calorie log.
ScienceHow Many Calories Does an Ice Bath Burn? The Real Math
A typical 10-to-15-minute ice bath burns roughly 20 to 80 extra kcal (85 to 335 kJ) — less than a single banana, and an order of magnitude below the 250 to 500 kcal that plunge marketing claims. The measured literature is consistent: an 18 degree cooling suit raised energy expenditure by 250 kcal across three full hours, the 88-minute world-record ice immersion roughly doubled heat production from 169 to 321 watts, and a meta-analysis of 10 randomised trials put mild cold exposure at 188 extra kcal per day. Even six weeks of two-hours-daily cold acclimation lifted cold-induced thermogenesis to only 289 kcal a day. Real physiology, trivial energy cost — the protocol-by-protocol table, the shivering math behind the vendor claims, and how to log a plunge honestly.
ScienceCan You Only Absorb 30g of Protein Per Meal? The Data
The claim that your body can only absorb 30 g of protein per meal fails on both halves. Your gut absorbs virtually all the protein you eat — the real question is how much your muscle uses — and the best-measured feeding study to date answered it: 100 g of milk protein kept muscle protein synthesis elevated for more than 12 hours, beating a 25 g dose by roughly 40 percent in the 4-to-12-hour window, with almost none of the extra oxidised away. Where the 30 g figure came from, what the dose-response trials from 20 g to 100 g actually show, the per-meal targets by body weight, and what it all means for how you log protein.