The Satiety Index: Which Foods Fill You Up Per Calorie
Boiled potatoes scored 323 on the satiety index — the most filling food per calorie ever measured — while a croissant scored 47, a seven-fold gap at identical 1,000 kJ (240 kcal) servings. The 1995 University of Sydney study behind the index fed 38 common foods to fasted adults and rated fullness every 15 minutes for two hours: fish (225) beat beef (176), porridge (209) beat every boxed cereal, and oranges (202) and apples (197) roughly doubled white bread. The full ranked table, the four properties that predicted fullness — serving weight, water, protein, and fibre — and how to use satiety per calorie inside a deficit without giving up the foods you enjoy.
kcalm editorial team
Prepared with AI assistance
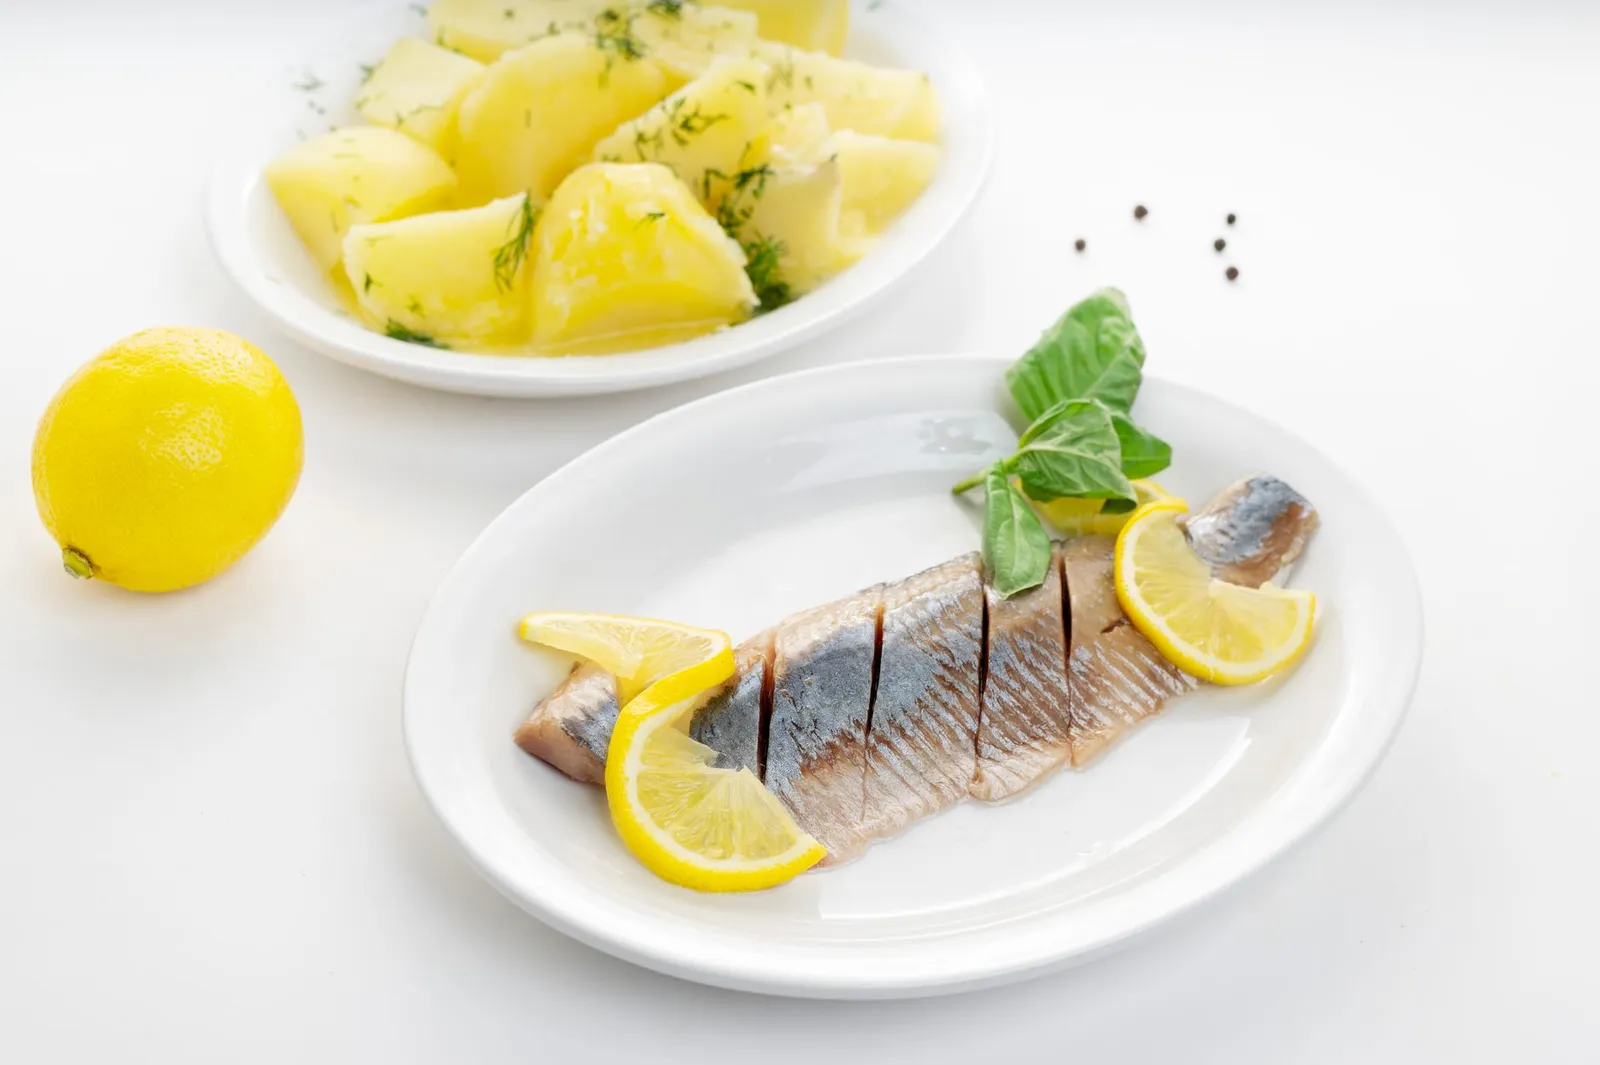
Boiled potatoes are the most filling food ever measured per calorie, scoring 323 on the satiety index — more than three times white bread at 100, and seven times a croissant at 47. As of August 2026, the University of Sydney study behind that ranking remains the only controlled head-to-head of 38 common foods at identical 1,000 kJ (240 kcal) servings. Serving weight, water, protein, and fibre pushed fullness up; fat and palatability pushed it down.
Every calorie tracker treats 1,000 kJ of croissant and 1,000 kJ of boiled potato as the same entry in your daily total — and for energy balance, they are. What the log cannot show is how differently those two servings land in your stomach. One occupies a few pastry-flake bites; the other is a plate of food that takes minutes to eat and hours to leave.
In 1995, researchers at the University of Sydney put a number on that difference. They fed 38 everyday foods to fasted adults at equal-calorie servings and measured how full each one made people feel across the following two hours [1]. The result — the satiety index — is still the most-cited fullness-per-calorie ranking in nutrition science, and its top and bottom entries are genuinely surprising. This post lays out the full table, the food properties that predicted the scores, and a practical way to fold the findings into a calorie target without turning eating into a rulebook.
What is the satiety index?
The satiety index is a ranking of how full 38 common foods made people feel over two hours, each tested at an identical 1,000 kJ (240 kcal) serving and scored against white bread set to 100. It was published by Susanna Holt and colleagues at the University of Sydney in 1995 and remains the reference dataset for fullness per calorie [1].
The design was simple and strict. Groups of 11 to 13 fasted participants ate a 1,000 kJ serving of a test food, then rated their fullness every 15 minutes for 120 minutes. After the two hours, they were free to eat from a standard buffet while the researchers recorded what they took. Each food's fullness ratings were converted to a single score — the area under its two-hour satiety curve, divided by the same measure for white bread, multiplied by 100 [1].
| Term | What it means |
|---|---|
| Satiety index (SI) | Fullness produced by a 1,000 kJ (240 kcal) serving of a food, scored against white bread = 100 |
| Satiation | The process that ends a meal while you are eating it |
| Satiety | The fullness that delays the next meal after you finish |
| Energy density | Calories per gram of food — low-density foods give more weight and volume per kJ |
Which foods keep you full per calorie?
Boiled potatoes top the satiety index at 323, followed by ling fish at 225, porridge at 209, oranges at 202, and apples at 197. Croissants (47), cake (65), and doughnuts (68) sit at the bottom. Every score below compares an identical 1,000 kJ (240 kcal) serving against white bread at 100 [1][7].
Here is the full ranked table from the study [1][7]:
| Rank | Food | Category | Satiety index |
|---|---|---|---|
| 1 | Boiled potatoes | Carbohydrate-rich | 323 |
| 2 | Ling fish | Protein-rich | 225 |
| 3 | Porridge (oatmeal) | Breakfast cereal | 209 |
| 4 | Oranges | Fruit | 202 |
| 5 | Apples | Fruit | 197 |
| 6 | Brown pasta | Carbohydrate-rich | 188 |
| 7 | Beef steak | Protein-rich | 176 |
| 8 | Baked beans in tomato sauce | Protein-rich | 168 |
| 9 | Grapes | Fruit | 162 |
| 10 | Wholemeal bread | Carbohydrate-rich | 157 |
| 11 | Grain bread | Carbohydrate-rich | 154 |
| 11 | Popcorn | Snack | 154 |
| 13 | All-Bran | Breakfast cereal | 151 |
| 14 | Eggs | Protein-rich | 150 |
| 15 | Cheese | Protein-rich | 146 |
| 16 | White rice | Carbohydrate-rich | 138 |
| 17 | Lentils in tomato sauce | Protein-rich | 133 |
| 18 | Brown rice | Carbohydrate-rich | 132 |
| 18 | Honeysmacks | Breakfast cereal | 132 |
| 20 | Crackers | Bakery | 127 |
| 21 | Cookies | Bakery | 120 |
| 22 | White pasta | Carbohydrate-rich | 119 |
| 23 | Bananas | Fruit | 118 |
| 23 | Jellybeans | Snack | 118 |
| 23 | Cornflakes | Breakfast cereal | 118 |
| 26 | French fries | Carbohydrate-rich | 116 |
| 26 | Special K | Breakfast cereal | 116 |
| 28 | Sustain | Breakfast cereal | 112 |
| 29 | White bread | Carbohydrate-rich | 100 |
| 29 | Muesli | Breakfast cereal | 100 |
| 31 | Ice cream | Snack | 96 |
| 32 | Crisps (potato chips) | Snack | 91 |
| 33 | Low-fat strawberry yoghurt | Snack | 88 |
| 34 | Peanuts | Snack | 84 |
| 35 | Mars bar | Snack | 70 |
| 36 | Doughnuts | Bakery | 68 |
| 37 | Cake | Bakery | 65 |
| 38 | Croissants | Bakery | 47 |

A few patterns are worth pausing on. Plain boiled potatoes more than doubled the score of their fried form — French fries managed 116 from the same vegetable, because frying removes water and adds fat, roughly tripling the calories in every 100 g. Fish outscored beef and eggs among the proteins. Porridge beat every boxed cereal tested, including the bran-based ones. And whole fruit — oranges, apples, grapes — landed near the top while fruit-flavoured yoghurt landed near the bottom, a gap that says more about food structure and water content than about sugar.
Peanuts sitting at 84 looks damning for nuts, but it deserves nuance: nuts compress a lot of energy into a small, easy-to-eat weight, which is exactly what the index penalises. They also bring fibre, protein, and unsaturated fat, and research on measured nut calories shows a portion of their labelled energy is never absorbed at all. A low satiety score is not a verdict on a food's quality — it is one measured property among many.
Why are some foods more filling than others?
Serving weight predicted fullness best: at equal calories, heavier and more water-rich foods scored higher (r = 0.66 and r = 0.64). Protein (r = 0.37) and fibre (r = 0.46) raised scores, while fat (r = −0.43) and palatability (r = −0.64) lowered them [1]. In practice, satiety per calorie mostly tracks how much food 1,000 kJ buys.
| Food property | Correlation with satiety index | Direction |
|---|---|---|
| Serving weight (grams per 1,000 kJ) | r = 0.66 | Higher weight, more filling |
| Water content | r = 0.64 | More water, more filling |
| Fibre content | r = 0.46 | More fibre, more filling |
| Protein content | r = 0.37 | More protein, more filling |
| Fat content | r = −0.43 | More fat, less filling per kJ |
| Palatability rating | r = −0.64 | Tastier foods rated less filling |
Protein earns its reputation more modestly than the marketing suggests. In the Holt data it mattered (r = 0.37), and a 2008 review in the American Journal of Clinical Nutrition concluded that protein generally increases satiety to a greater extent than carbohydrate or fat [2]. Part of the mechanism is hormonal — protein raises the fullness signals GLP-1, CCK, and PYY while lowering the hunger hormone ghrelin — and part is thermic: digesting protein costs 20 to 30 percent of its own calories, against 5 to 10 percent for carbohydrate and 0 to 3 percent for fat [6]. How those hunger hormones drive appetite is a post of its own.
Fibre is the most over-simplified driver. Intact fibre inside whole foods — the structure of an apple, the beta-glucan in oats — clearly contributed to high scores. But a 2013 systematic review of 107 fibre treatments across 44 studies found that only 39 percent significantly reduced appetite ratings and just 22 percent reduced actual food intake [3]. Adding isolated fibre to a food is not a reliable fullness upgrade; eating foods that are fibrous by construction appears to work far better.
The palatability correlation (r = −0.64) is the finding most often misread as "tasty food is the enemy." A gentler reading: foods engineered to be easy to keep eating are, by design, easy to keep eating. That is useful information for portioning, not a reason to moralise about croissants.
How do you use the satiety index for weight loss?
Consider the satiety index a swap list, not a rulebook: keep your calorie target unchanged and tilt more of it toward high-scoring foods — potatoes, fish, porridge, eggs, legumes, and whole fruit. In a year-long trial, women who added water-rich foods lost 7.9 kg while eating 25 percent more food by weight than the comparison group [5].
That trial is worth knowing. Researchers randomised 97 women with obesity to either a reduced-fat diet or a reduced-fat diet plus more water-rich foods, with no calorie limit in either arm. After 12 months the water-rich group had lost 7.9 kg against 6.4 kg, reported measurably less hunger, and ate a quarter more food by weight — their diet's energy density had dropped to 1.23 kcal/g against the comparison group's 1.46 [5]. Fullness per calorie, applied at the level of a whole diet, moved both the scale and the hunger ratings in the right direction at once.
A practical protocol for folding the index into tracking:
- Anchor each meal on one high-SI food. A palm of potato, a fillet of fish, a bowl of porridge, two eggs, or a serve of baked beans in tomato sauce covers most meals of the day.
- Swap at equal calories, not equal portions. The index only holds when the kilojoules match — trade 1,000 kJ of pastry for 1,000 kJ of porridge and the calorie line of your day does not move, but the next two hours feel different.
- Log the swap and watch what happens next. Photo-log the meal, then notice the gap before you next feel like eating. In the original study, higher-SI foods measurably reduced buffet intake two hours later [1].
- Treat drinkable calories as low-satiety by default. Semi-liquid, fast-to-consume items clustered at the bottom of the table; the same calories in whole-food form buy more fullness.
- Judge the week, not the day. Satiety swaps show up as an easier deficit over a weekly average — the same lens that solves the 1,200-calories-and-not-losing mystery.
| Instead of | Try at the same 1,000 kJ | Satiety index change |
|---|---|---|
| Croissant | Porridge with milk | 47 to 209 |
| Crisps | Air-popped popcorn | 91 to 154 |
| White bread | Wholemeal bread | 100 to 157 |
| Mars bar | Two oranges | 70 to 202 |
| White pasta | Brown pasta | 119 to 188 |
None of this requires abandoning low-SI foods. A croissant eaten deliberately, logged honestly, and enjoyed is compatible with any sensible target — the index simply tells you it will not do much work keeping you full, so the surrounding meals may need to.
What are the limits of the satiety index?
The satiety index measured single foods, eaten alone by groups of 11 to 13 young adults, over a two-hour window — a controlled snapshot, not a diet plan. Scores blur inside mixed meals, the 1995 food list predates much of the modern supermarket, and fullness per calorie is one input to food choice, not a verdict on nutrition.
The honest caveats, in order of weight. First, sample size: 11 to 13 raters per food is enough to separate a potato from a croissant, but the standard deviations were wide — potatoes came in at 323 ± 51 — so neighbouring foods on the table are statistically indistinguishable [1]. Second, the two-hour window captures the gap between breakfast and morning tea, not all-day appetite regulation; research on longer horizons leans on energy density and whole-diet patterns instead [4][5]. Third, single foods eaten alone are an experimental convenience — dressing your potato in butter shifts its weight, fat, and palatability all at once, and no one has re-run the full 38-food protocol at scale since.
There is also a between-person truth the averages hide: satiety responses vary with habits, sleep, stress, and training, which is why research suggests treating any index as a starting point and your own log as the final authority. If tracking itself tends to tip you into rigidity, the balance between tracking and intuitive eating matters more than any table.
What the index still does, three decades on, is answer one question cleanly: at identical calories, which foods buy the most fullness? That answer — heavy, water-rich, fibrous, protein-bearing foods, with boiled potatoes an outlier champion — has held up remarkably well against everything published since [2][4].
Frequently Asked Questions
Is the satiety index the same as the glycaemic index?
No. Both came out of the University of Sydney's nutrition research groups, but the glycaemic index measures the blood-glucose response to 50 g of carbohydrate, while the satiety index measures rated fullness after 1,000 kJ (240 kcal) of a whole food [1]. A food can rank high on one and low on the other — white rice has a high GI and a mid-table SI of 138.
Are boiled potatoes really more filling than fish or steak?
Per calorie, yes — 323 against 225 for ling fish and 176 for beef steak in the original data [1]. A 1,000 kJ serve of boiled potato is simply a much larger plate of food than 1,000 kJ of steak. Per typical serve at a real dinner, a larger steak portion may leave you fuller; the index compares foods only at matched energy.
Why does yoghurt score so low on the satiety index?
The tested item was a low-fat strawberry yoghurt — semi-liquid, quick to eat, and modest in weight at 1,000 kJ — and it scored 88 [1][7]. Semi-liquid calories consistently rate less filling than solid ones. That is a texture finding, not a nutrition finding: a protein-rich plain Greek yoghurt with fruit is a very different food from the 1995 test item.
Do low-satiety foods stop weight loss?
No. Energy balance decides weight change, and a 2007 year-long trial showed the same reduced-fat prescription produced meaningful loss with or without the high-satiety emphasis — 6.4 kg versus 7.9 kg [5]. High-SI foods make a deficit easier to hold; they do not change the arithmetic.
Has the satiety index been repeated with more foods?
Not at the original scale. The 38-food, 1,000 kJ protocol from 1995 remains the canonical dataset [1]. Later research validated its drivers — protein's edge over carbohydrate and fat [2], energy density's effect on intake [4], and fibre's mixed record in isolation [3] — rather than re-ranking the supermarket.
How do I combine the satiety index with calorie tracking?
Keep your calorie or kilojoule target exactly as it is and use the index to choose what fills it. Anchor meals on high-SI foods, make equal-calorie swaps from the table above, and photo-log meals so the swaps are visible in your history. Over a few weeks, your own hunger notes and weekly weight trend will show whether the changes are earning their place.
Sources
- Holt SH, Miller JC, Petocz P, Farmakalidis E. A satiety index of common foods. European Journal of Clinical Nutrition, 1995. https://eutils.ncbi.nlm.nih.gov/entrez/eutils/efetch.fcgi?db=pubmed&id=7498104&rettype=abstract&retmode=text
- Paddon-Jones D, Westman E, Mattes RD, Wolfe RR, Astrup A, Westerterp-Plantenga M. Protein, weight management, and satiety. American Journal of Clinical Nutrition, 2008. https://eutils.ncbi.nlm.nih.gov/entrez/eutils/efetch.fcgi?db=pubmed&id=18469287&rettype=abstract&retmode=text
- Clark MJ, Slavin JL. The effect of fiber on satiety and food intake: a systematic review. Journal of the American College of Nutrition, 2013. https://eutils.ncbi.nlm.nih.gov/entrez/eutils/efetch.fcgi?db=pubmed&id=23885994&rettype=abstract&retmode=text
- Rolls BJ. The relationship between dietary energy density and energy intake. Physiology and Behavior, 2009. https://eutils.ncbi.nlm.nih.gov/entrez/eutils/efetch.fcgi?db=pubmed&id=19303887&rettype=abstract&retmode=text
- Ello-Martin JA, Roe LS, Ledikwe JH, Beach AM, Rolls BJ. Dietary energy density in the treatment of obesity: a year-long trial comparing 2 weight-loss diets. American Journal of Clinical Nutrition, 2007. https://pmc.ncbi.nlm.nih.gov/articles/PMC2018610/
- Moon J, Koh G. Clinical evidence and mechanisms of high-protein diet-induced weight loss. Journal of Obesity and Metabolic Syndrome, 2020. https://pmc.ncbi.nlm.nih.gov/articles/PMC7539343/
- Satiety value — full satiety index table reproduction. Wikipedia. https://en.wikipedia.org/wiki/Satiety_value
Ready to track smarter?
Join thousands who use kcalm for calorie tracking. AI-powered food recognition, scientifically-validated calculations, and zero anxiety.
Related Articles
Body Fat Percentage Calculators: Which Can You Trust?
Compare body fat percentage calculators, BMI, Navy tape, smart scales and DXA using published research, practical examples and clear measurement limits.
ScienceAfterburn Effect: How Many Extra Calories Does EPOC Burn?
Explore the afterburn effect with measured EPOC calories, kcal and kJ comparisons, research limitations and practical advice for your calorie log.
ScienceSauna Calories Burned: What the Studies Really Measure
Explore sauna calories burned, what heat studies actually measured, why water loss differs from fat loss and how to handle uncertain numbers in your food log.