Swimming Calorie Calculator: Stroke, Pace, and Watch Math
Swimming burns roughly 340 to 970 kcal (1,420 to 4,060 kJ) per hour for a 70 kg adult, and the spread is set by stroke and pace: the 2024 Adult Compendium of Physical Activities puts recreational backstroke at 4.8 METs, slow freestyle at 5.8, medium-pace crawl at 8.0, and butterfly at 13.8 — while your watch struggles to see any of it. In the key validation study, a wrist device that read heart rate within 4 percent on land drifted to a 30 percent mean error in the pool, its correlation with a chest strap collapsing from 0.95 to 0.26. The stroke-by-stroke MET tables in kcal and kJ, the pace math from elite-swimmer energy-cost data, why optical sensors fail in water, and a five-step way to log a swim your weight trend can verify.
kcalm editorial team
Prepared with AI assistance
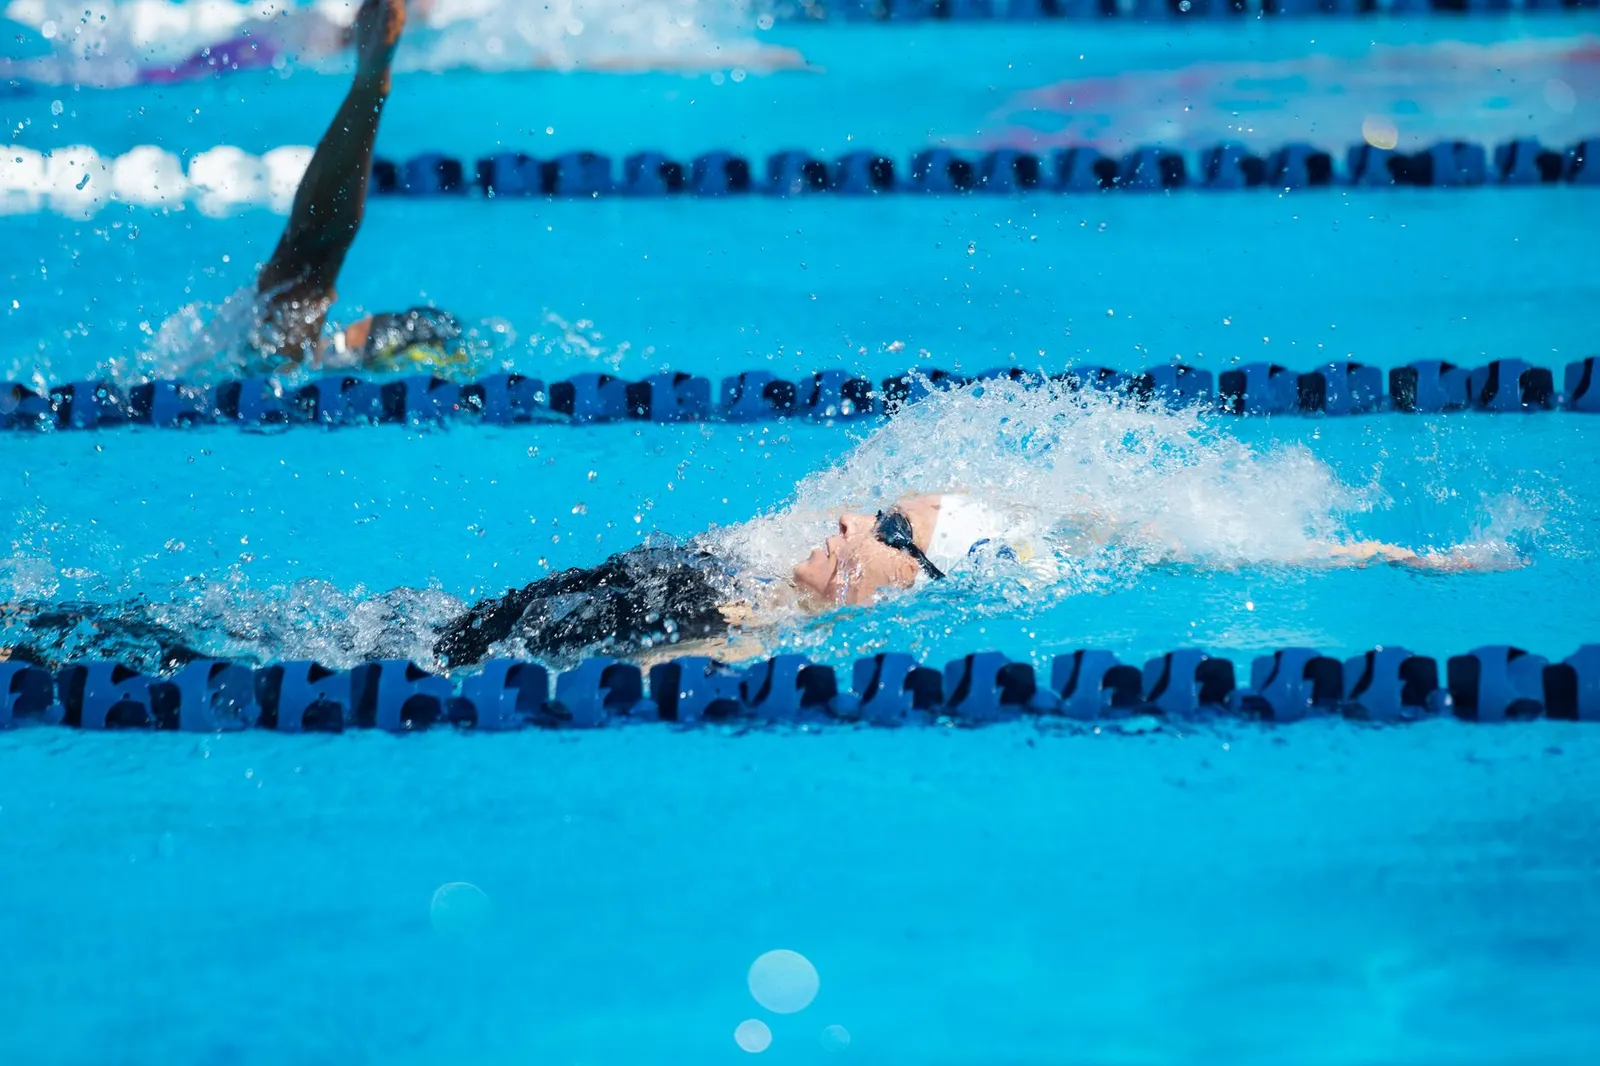
Swimming burns roughly 340 to 970 kcal (1,420 to 4,060 kJ) per hour for a 70 kg adult, depending on stroke and pace. As of September 2026, the 2024 Adult Compendium of Physical Activities puts recreational backstroke at 4.8 METs (336 kcal per hour at 70 kg), slow freestyle at 5.8 METs (406 kcal), medium-pace crawl at 8.0 METs (560 kcal), and butterfly at 13.8 METs (966 kcal) [1][2]. Multiplying the MET value by your weight in kilograms gives a steadier estimate than the number on your wrist, because optical heart-rate sensors degrade badly in water [3].
Swimming is the one cardio modality where the usual advice — "just check your watch" — works worst. On land, a wrist sensor reads your pulse through stable skin contact; in the pool, water slides under the sensor with every stroke and the signal falls apart. That leaves swimmers relying on the least accurate output of an already-struggling device, which is why a table of measured MET values may serve your log better than any wearable number.
This post completes our cardio calculator set — walking, running, cycling, and rucking are already covered — with the stroke-by-stroke swimming tables in kcal and kJ, the energy-cost-per-metre research from swimmers measured with gas analysis, and a practical way to log a swim without trusting a heart-rate sensor that cannot see your heart.
How many calories does swimming burn per hour?
A 70 kg (154 lb) adult burns about 406 kcal (1,700 kJ) per hour swimming slow freestyle, 560 kcal (2,340 kJ) at a medium-pace crawl, and 966 kcal (4,040 kJ) swimming butterfly, based on the measured MET values in the 2024 Adult Compendium of Physical Activities [1][2].
The arithmetic behind those figures is the standard MET method: one MET is defined as roughly 1 kcal per kilogram of body weight per hour, so calories per hour equal the MET value multiplied by your weight in kilograms [1]. The 2024 Compendium — the reference catalogue of 1,114 measured activity energy costs, with 82 percent of entries backed by direct measurement — lists separate codes for each stroke at recreational and training pace [1][2]. We covered the method itself in our MET calorie calculator guide; here are the swimming rows:
| Stroke and pace | METs | kcal per hour (70 kg) | kJ per hour (70 kg) |
|---|---|---|---|
| Treading water, moderate | 3.5 | 245 | 1,025 |
| Backstroke, recreational | 4.8 | 336 | 1,405 |
| Breaststroke, recreational | 5.3 | 371 | 1,550 |
| Freestyle, slow (30–45 yd/min) | 5.8 | 406 | 1,700 |
| Leisurely swimming, general | 6.0 | 420 | 1,760 |
| Sidestroke, general | 7.0 | 490 | 2,050 |
| Crawl, medium (~50 yd/min) | 8.0 | 560 | 2,340 |
| Freestyle laps, fast, vigorous | 9.8 | 686 | 2,870 |
| Backstroke, training pace | 9.5 | 665 | 2,780 |
| Breaststroke, training pace | 10.3 | 721 | 3,015 |
| Crawl, fast (~75 yd/min) | 10.5 | 735 | 3,075 |
| Butterfly, general | 13.8 | 966 | 4,040 |
| Stroke and pace | 60 kg (132 lb) | 70 kg (154 lb) | 85 kg (187 lb) | 100 kg (220 lb) |
|---|---|---|---|---|
| Backstroke, recreational (4.8 METs) | 144 kcal | 168 kcal | 204 kcal | 240 kcal |
| Freestyle, slow (5.8 METs) | 174 kcal | 203 kcal | 247 kcal | 290 kcal |
| Leisurely swimming (6.0 METs) | 180 kcal | 210 kcal | 255 kcal | 300 kcal |
| Crawl, medium (8.0 METs) | 240 kcal | 280 kcal | 340 kcal | 400 kcal |
| Butterfly (13.8 METs) | 414 kcal | 483 kcal | 587 kcal | 690 kcal |
Which swimming stroke burns the most calories?
Butterfly burns the most calories of any stroke at 13.8 METs — about 966 kcal (4,040 kJ) per hour for a 70 kg swimmer. Among strokes most people can sustain, fast crawl (9.8 to 10.5 METs) and training-pace breaststroke (10.3 METs) lead, while recreational backstroke is the gentlest at 4.8 METs [2].
Pace moves the number more than stroke choice does. The same front crawl spans 5.8 METs at an easy 30 to 45 yards per minute and 14.5 METs at elite competition speed — a 2.5-fold range within one stroke [2]. Research that measured swimmers directly with gas analysis shows why: in a study of 26 competitive swimmers, the energy cost of front crawl in males averaged 1.8 kJ per metre at 50 m sprint pace but only 1.0 kJ per metre at 200 m pace — nearly double the cost per metre for the faster swim [5]. Water resistance rises steeply with speed, so small pace increases buy disproportionately large calorie costs.
At the elite end, a study of ten swimmers racing a maximal 200 m front crawl measured an average energy cost of 1.60 kJ per metre — roughly 0.38 kcal for every metre travelled — with the anaerobic contribution climbing sharply over the final laps [4]. For context, that means an elite 200 m race costs only about 76 kcal (320 kJ) in total: brutal intensity, short duration, modest calories. It is the same lesson our running calculator teaches — per-session calories come from duration and body mass far more than from how hard any single minute feels.
Two practical consequences follow:
- Continuous laps beat heroic intervals for total burn. Forty minutes of medium crawl (about 373 kcal at 70 kg) outburns ten minutes of butterfly (161 kcal) plus thirty minutes of rest.
- Technique quietly lowers your burn per lap. As your stroke improves, the same distance costs less energy — research on competitive swimmers found lean mass and hydrodynamic resistance explained most of the variation in energy cost [5]. Consider that a reason to re-estimate honestly rather than a problem: better technique usually means you can swim further at the same effort.
Why is your watch less accurate in the pool?
Optical wrist sensors lose skin contact and signal quality in water. In a 2022 validation against a chest-strap reference, a wrist device that measured heart rate within about 4 percent on land drifted to a roughly 30 percent mean error during swimming, with its correlation to the reference collapsing from 0.95 to 0.26 [3].
The study, published in the journal Sensors, put ten trained swimmers through treadmill and pool sessions wearing two popular wrist wearables against a Polar H10 chest strap [3]. The land-versus-water gap was stark:
| Device and condition | Mean bias | Mean absolute percentage error | Correlation with chest strap |
|---|---|---|---|
| Garmin Venu Sq — land | −1 bpm | 4.1% | 0.95 |
| Garmin Venu Sq — swimming | −44 bpm | 30.0% | 0.26 |
| Polar Vantage V2 — land | −5 bpm | 8.0% | 0.85 |
| Polar Vantage V2 — swimming | −14 bpm | 17.2% | 0.59 |
Watch makers know this, which is why swim modes lean heavily on the accelerometer instead: stroke counting, lap detection, and distance feed a model that resembles the MET table above, with extra guesswork layered on. That can land in a sensible range, but you have no way to see when it has not. The wider context is worth knowing too — even on land, no wrist device in Stanford testing estimated energy expenditure within 20 percent, so the pool takes an already-weak number and degrades its main input further.
How do you log a swim in your calorie tracker?
Log swims from the MET table rather than the watch: note your stroke, honest pace, and minutes actually swum, multiply METs by your weight in kilograms and hours, and treat the result as an estimate to verify against your weight trend [1][2].
A repeatable version of that takes about a minute:
- Time your actual swimming, not your session. Rest at the wall is closer to treading water (3.5 METs) than to laps; 45 minutes at the pool is often 30 minutes of swimming.
- Pick the Compendium row that matches your honest pace. If you can hold a conversation-adjacent effort, that is recreational or slow — 4.8 to 5.8 METs — not the vigorous rows.
- Run the math in your units. METs × weight (kg) × hours gives kcal; multiply by 4.18 for kJ. A 70 kg swimmer logging 30 minutes of medium crawl records 280 kcal (1,170 kJ).
- Log it consistently and resist eating it all back. The estimate carries real error either way, and the double-counting math applies to pool sessions exactly as it does to gym sessions.
- Let your weight trend arbitrate. Over 2 to 4 weeks, your own log and trend line reveal your true energy balance more reliably than any per-session estimate — if the trend disagrees with the math, trust the trend.
Swimming also has a well-known appetite effect — many swimmers report stronger post-swim hunger than after equivalent land exercise, possibly related to cooler body temperature after immersion. The research there is still unsettled, so no adjustment factor is offered; it is simply worth knowing that a 400 kcal swim followed by an unlogged 500 kcal snack is a net surplus, and the pool did nothing wrong.
Frequently Asked Questions
How many calories does 30 minutes of swimming burn?
For a 70 kg (154 lb) adult, about 203 kcal (850 kJ) at slow freestyle, 280 kcal (1,170 kJ) at medium crawl, and 483 kcal (2,020 kJ) at butterfly, using 2024 Compendium MET values [2]. Scale linearly for your weight: at 85 kg the medium-crawl figure rises to about 340 kcal (1,420 kJ).
Does swimming burn more calories than running?
At matched effort they are close. Fast freestyle laps (9.8 METs) sit almost exactly at the cost of running around 9.7 km/h, and elite crawl (14.5 METs) matches hard running [1][2]. In practice most people sustain running longer and swim slower than they think, so the honest comparison depends on which one you will actually do for 30-plus minutes.
Why does my watch show fewer calories for swimming than for running?
Partly physics, partly caution. Optical heart-rate sensors underread in water — one validation measured a mean bias of −44 bpm during swimming [3] — so devices fall back on motion-based models that tend toward conservative estimates. A lower number for the same perceived effort does not mean the swim was easier; it means the device had less signal to work with.
Does cold water make you burn more calories swimming?
Cool water adds a real but modest thermoregulation cost, and it is not separately itemised in the Compendium swim values [2]. The better-documented effect runs through appetite: swimmers commonly eat more after cool-water sessions, which may outweigh any extra burn. Research suggests treating post-swim hunger, not water temperature, as the variable worth managing.
Is treading water good exercise?
Moderate treading water costs about 3.5 METs — 245 kcal (1,025 kJ) per hour at 70 kg — similar to brisk walking, while vigorous treading reaches 9.8 METs [2]. It is a legitimate calorie cost, which is also why counting rest-at-the-wall time as "swimming" inflates a log.
Which stroke is best for weight loss?
The one you can sustain longest, swum most often. Butterfly tops the table at 13.8 METs but few people hold it beyond short intervals; a 40-minute medium crawl outburns a 10-minute butterfly set by more than two to one at 70 kg [2]. Total weekly minutes in the water predict energy expenditure better than stroke selection.
Sources
- Herrmann SD, Willis EA, Ainsworth BE, et al. 2024 Adult Compendium of Physical Activities: A third update of the energy costs of human activities. Journal of Sport and Health Science. 2024;13(1):6–12. https://pmc.ncbi.nlm.nih.gov/articles/PMC10818145/
- 2024 Adult Compendium of Physical Activities — Water Activities MET values. Compendium of Physical Activities. https://pacompendium.com/water-activities/
- Cosoli G, Antognoli L, Veroli V, Scalise L. Accuracy and Precision of Wearable Devices for Real-Time Monitoring of Swimming Athletes. Sensors. 2022;22(13):4726. https://pmc.ncbi.nlm.nih.gov/articles/PMC9269005/
- Figueiredo P, Pendergast DR, Vilas-Boas JP, Fernandes RJ. Interplay of Biomechanical, Energetic, Coordinative, and Muscular Factors in a 200 m Front Crawl Swim. BioMed Research International. 2013. https://pmc.ncbi.nlm.nih.gov/articles/PMC3613086/
- Massini DA, et al. Are Young Swimmers Short and Middle Distances Energy Cost Sex-Specific? Frontiers in Physiology. 2021. https://pmc.ncbi.nlm.nih.gov/articles/PMC8712663/
Ready to track smarter?
Join thousands who use kcalm for calorie tracking. AI-powered food recognition, scientifically-validated calculations, and zero anxiety.