Cycling Calorie Calculator: Power, Heart Rate, or Speed
Speed-based cycling calorie estimates can miss the true energy cost by 30 to 60 percent depending on wind, gradient, and rider position. The 2013 Haakonssen power-meter validation in nine national-team female cyclists showed total mechanical work in kilojoules multiplied by 5.3 (a 19 percent gross efficiency assumption) matched criterion indirect calorimetry within roughly 1 percent at the group level, though individual errors averaged about 11 percent. The 2005 Keytel heart-rate equation reached an R of 0.913 against calorimetry across 115 exercising adults but carries individual error of 10 to 20 percent. What the strongest cycling energy-expenditure studies say about each method in 2026.
kcalm editorial team
Prepared with AI assistance
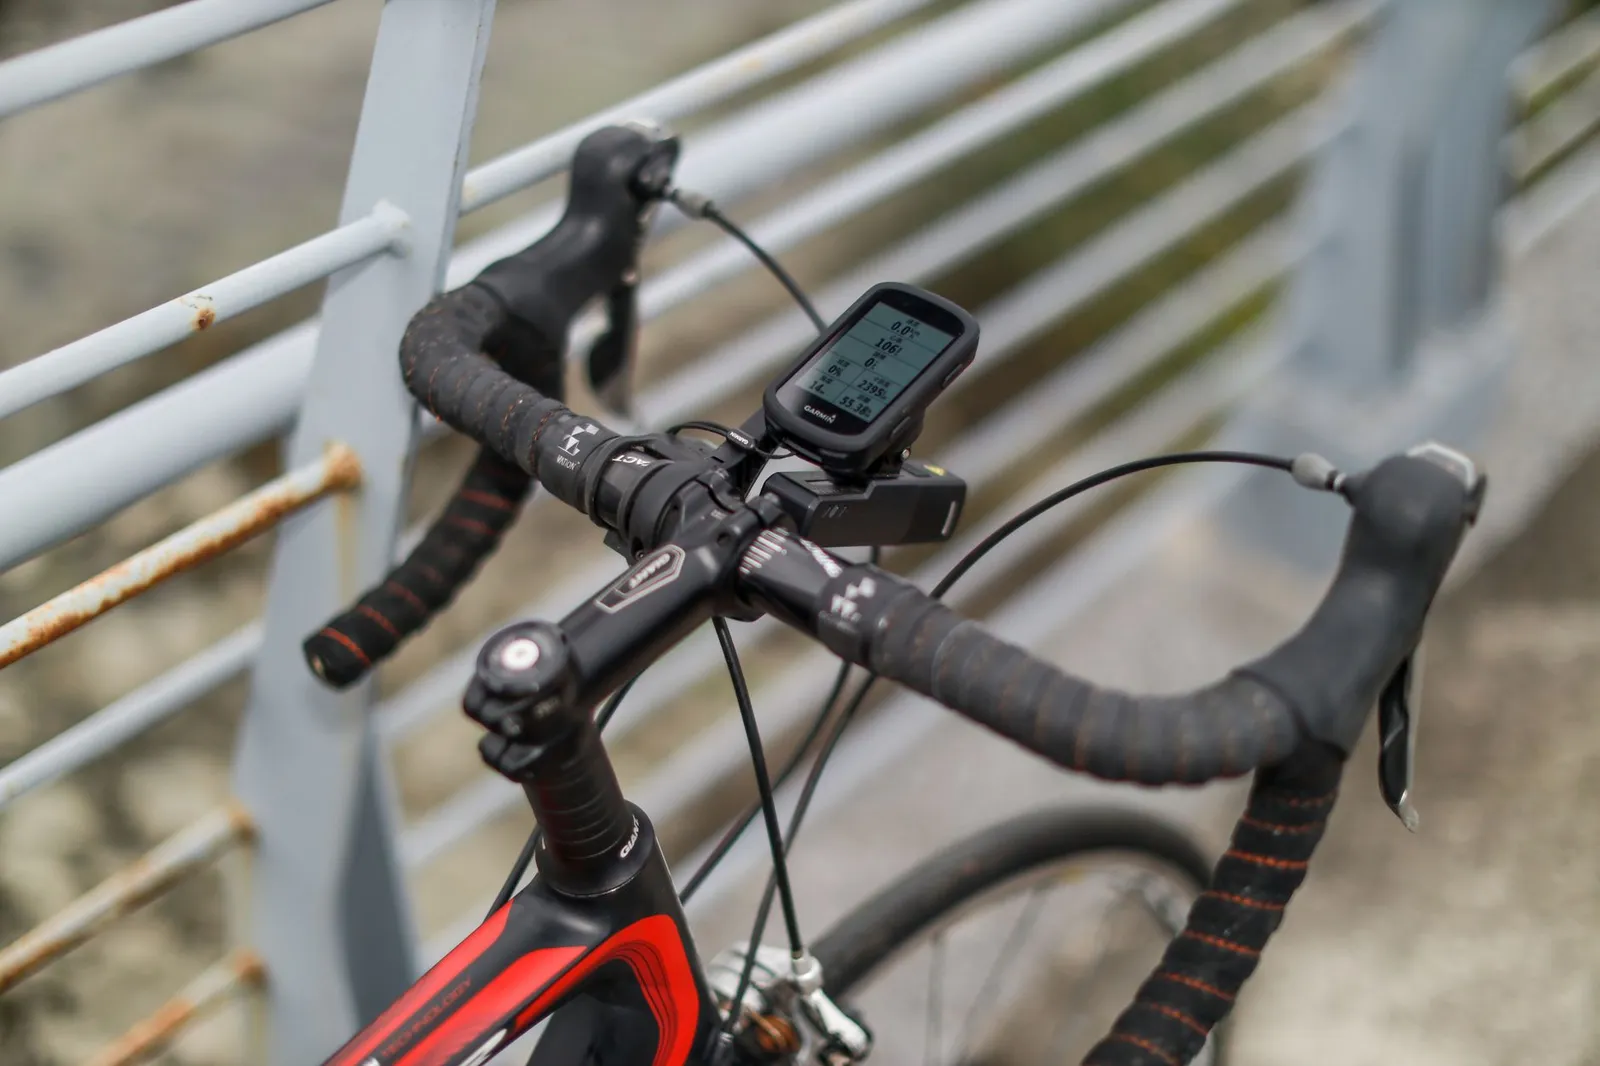
The most accurate way to estimate cycling calories is a calibrated power meter — the 2013 Haakonssen study in nine national-team female cyclists validated total mechanical work in kilojoules multiplied by 5.3 (a 19 percent gross efficiency assumption) against indirect calorimetry and matched criterion energy expenditure within roughly 1 percent at the group level. Heart-rate methods using the 2005 Keytel equation reach an R of 0.913 across 115 exercising adults but drift 10 to 20 percent per rider. Speed-based estimates in consumer apps can diverge by 3x on the same ride.
If you have ever finished a bike ride and watched Strava report 243 kilocalories while your Garmin claims 930 for the same effort, you have met the reason cycling energy expenditure is the messiest number in consumer fitness. Three estimation methods dominate — power meters, heart-rate equations, and speed-based algorithms — and they can disagree by nearly an order of magnitude depending on wind, gradient, rider fitness, and how the app was calibrated. This guide translates the strongest cycling energy-expenditure validation studies from 2005 through 2024 into a working method for choosing an estimator that matches the equipment on your bike, and shows the math each method actually runs in both kilocalories and kilojoules.
The sources below come from peer-reviewed work in the Journal of Sports Sciences (Keytel and colleagues 2005 heart-rate energy expenditure model), Medicine and Science in Sports and Exercise (Haakonssen and colleagues 2013 constant vs variable-intensity power meter study), PLoS ONE (Klass and colleagues 2019 Actiheart validation during high-intensity cycling), Sensors (Bouillod and colleagues 2022 scoping review of 74 power-meter validation studies), the Journal of Sport and Health Science (Herrmann and colleagues 2024 Adult Compendium of Physical Activities), and Physiological Reports (Formenti and colleagues 2015 pedaling-rate ergometer study). Where the effect size depends on rider fitness or intensity, the range is presented rather than a single point estimate.
Why do cycling calorie estimates vary so much between apps?
Because the three underlying methods measure fundamentally different signals. Power meters read actual mechanical work at the crank or hub. Heart-rate models translate a physiological response into oxygen uptake via regression. Speed-based methods assume a drag coefficient and gradient profile that rarely matches the real ride.
The gap most riders notice first is the Strava-versus-Garmin discrepancy. In documented rider reports, the two platforms have returned 243 kcal and 930 kcal for the same ride — a factor of nearly 4x on identical GPS data. The reason is not a bug: Strava's default calorie calculation without a paired power meter or heart-rate strap uses a speed-plus-mass estimate that treats the ride as if it were on flat pavement in still air. Garmin's default incorporates the rider's Firstbeat physiological profile and any paired sensor data. When both platforms see the same power file, they typically agree within 5 percent.
A 2020 systematic review of Garmin wearables concluded that mean absolute percentage error for energy expenditure "was unacceptable" across the majority of the 12 validity studies reviewed — the acceptable threshold being under 5 percent for controlled conditions. That review is worth reading alongside the wearables and nutrition tracking guide if you rely on a wrist device as your primary calorie signal, and the best calorie tracking apps comparison covers which apps let you input a per-workout correction.
How accurate is the power meter method for cycling calories?
A calibrated power meter is the most accurate consumer-grade method, with group-level agreement within roughly 1 percent of indirect calorimetry when kilojoules of mechanical work are multiplied by a rider-specific gross efficiency conversion. The 2013 Haakonssen study in nine national-team female cyclists showed 0.3 percent group-level bias when personalised power-to-efficiency regression was applied, though single-rider errors averaged about 11 percent using a group efficiency assumption.
Power meters output work in kilojoules — literally the integral of watts over time. The conversion to kilocalories runs through cyclist gross metabolic efficiency, which sits at 20 to 25 percent for most trained riders. The math looks like this: 1 kilojoule of mechanical work at 24 percent efficiency requires 4.17 kilojoules of metabolic energy input, and 4.17 kilojoules equals 0.997 kilocalories. That coincidence — the 4.184 kJ-per-kcal conversion factor and the roughly 24 percent efficiency almost cancelling each other — is why "1 kJ approximately 1 kcal" has become the practical shorthand for power-based cycling energy expenditure.
Worked example. If your ride file shows 720 kJ of mechanical work over the hour (an average of 200 watts sustained for 3,600 seconds), the estimated energy expenditure is approximately 720 kcal at 24 percent gross efficiency, or roughly 900 kcal at 20 percent. That range — 720 to 900 kcal for a 200 W hour — is realistic for individual rider variability. Fitness improves efficiency, so a highly trained rider tends to sit at the more efficient end and burn slightly fewer calories per kilojoule of work than a novice at the same wattage.
The 2022 Bouillod scoping review pooled 74 studies of power-meter validity and found that leading crank-based (SRM) and pedal-based (Garmin Vector 3, Favero Assioma) power meters agree with reference calibration rigs within 2 to 3 percent coefficient of variation for power outputs between 150 and 350 watts. Below 100 watts and above 800 watts, agreement widens. Left-only crank meters and single-sided pedal meters carry an additional 5 to 10 percent uncertainty from limb-asymmetry assumptions the review flagged as under-reported in most consumer marketing.
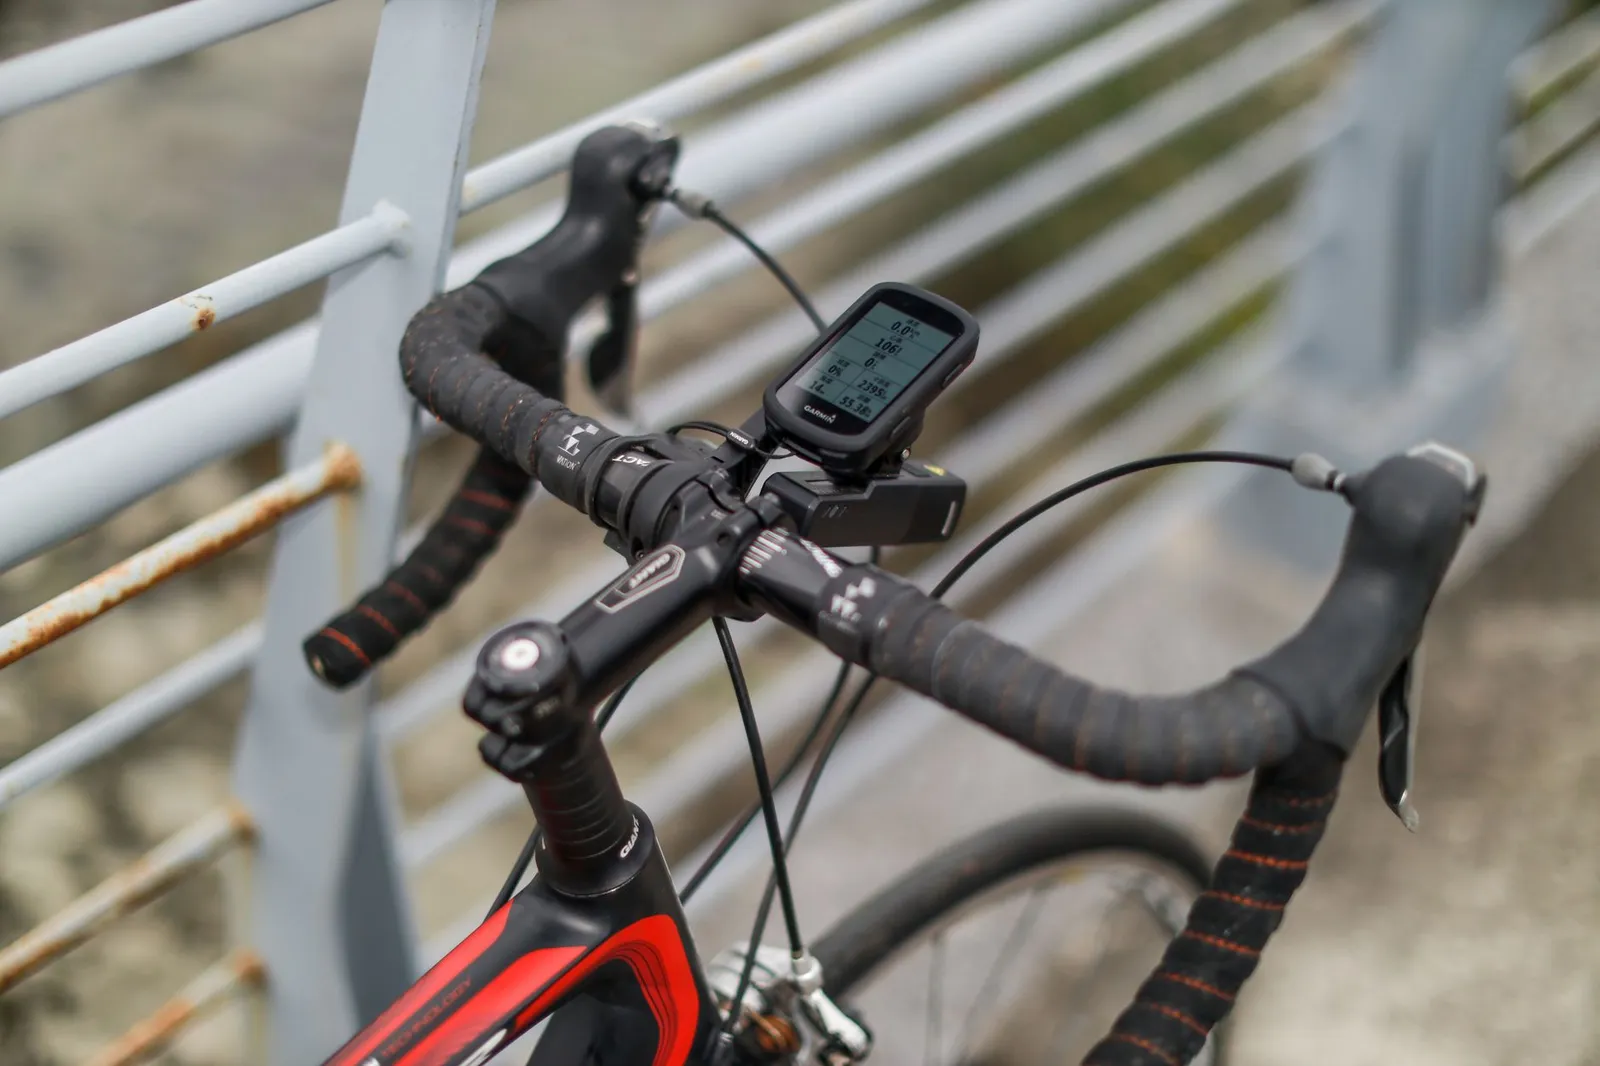
Comparison of the leading power-meter positions and their typical published error ranges:
| Meter position | Example | Typical CV vs reference | Notes |
|---|---|---|---|
| Crank-based (dual-sided) | SRM, Quarq DFour | 1.5 to 2.5 percent | Research gold standard |
| Pedal-based (dual-sided) | Garmin Vector 3, Favero Assioma Duo | 2 to 3 percent | Portable across bikes |
| Crank-arm (left-only) | Stages, 4iiii Precision | 3 to 5 percent | Assumes 50/50 left-right split |
| Hub-based | PowerTap G3 | 2 to 3 percent | Only reads rear-wheel power |
| Direct-drive smart trainer | Wahoo Kickr, Tacx Neo 2T | 1 to 2.5 percent | Indoor use only |
What does the heart-rate method get right and wrong?
Heart-rate energy expenditure sits between power meters and speed-based methods for accuracy. The 2005 Keytel regression across 115 exercising adults reported an R of 0.913 between predicted and measured energy expenditure — accounting for roughly 83 percent of variance — but individual errors of 10 to 20 percent are typical even when VO2max is included in the regression.
The Keytel equation looks like this. For men, energy expenditure (kcal/min) equals (minus 55.0969 plus 0.6309 times heart rate plus 0.1988 times weight in kilograms plus 0.2017 times age) divided by 4.184. For women, energy expenditure (kcal/min) equals (minus 20.4022 plus 0.4472 times heart rate minus 0.1263 times weight plus 0.0740 times age) divided by 4.184. Adding VO2max as an additional term reduces the standard error by roughly 15 percent in the original validation across 115 regularly exercising adults aged 18 to 45.
Two conditions weaken heart-rate energy expenditure badly. First, cardiac drift: heart rate rises 5 to 15 beats per minute over the course of a long steady effort in the heat as core temperature climbs and stroke volume falls, so the same real power output reads as progressively higher energy expenditure. Second, non-steady-state intervals: sprints and short high-intensity efforts spike heart rate above the linear-regression range Keytel was validated in, and the equation over-estimates the calorie cost. The 2019 Klass PLoS ONE study of 18 active adults on Actiheart monitors reported cycling underestimation of 3 to 12 percent using heart rate alone with group calibration, improving to intraclass correlation coefficients of 0.79 to 0.93 when individual calibration was applied.
The practical implication for consumer app users: a chest-strap heart-rate monitor paired with a well-calibrated app is a workable substitute for a power meter on steady rides. For interval training, criterium racing, or any effort with rapid intensity changes, the heart-rate method will be systematically off. The best calorie tracking apps comparison covers which apps read heart-rate zones and let you set a per-workout correction factor.
Where does speed-based estimation fall apart?
Speed-based cycling calorie estimates assume flat terrain, still air, an average drag coefficient, and a rider posture that never changes. Every one of those assumptions can be broken on almost every real ride, and the typical error against a power meter reference is 20 to 60 percent depending on which direction the wind and gradient point.
The physics of cycling energy demand is dominated by aerodynamic drag at speeds above roughly 25 km/h and by rolling resistance and gravity below that. A speed-only algorithm cannot see any of the inputs that actually matter: wind direction, gradient, road surface, tyre pressure, or rider position. The 2015 Formenti Physiological Reports study on pedaling-rate effects reported that the standard ACSM cycle-ergometer equation carried a bias of 3.2 mL O2/kg/min when cadence was ignored — a systematic underestimate of about 15 percent for high-cadence riders on the same absolute workload. Adding pedaling rate as a variable dropped the bias to 1.9 mL O2/kg/min.
Consumer apps compound the error. Strava's default calorie estimate without a paired power meter or heart-rate strap uses your speed, distance, and self-reported weight to interpolate against a fixed drag coefficient — the same assumption whether you are on a 40 km/h aero tri-bar breakaway or a 15 km/h upright commute. Garmin's default without paired sensors uses a similar speed-plus-mass approach but blends in the rider's Firstbeat physiological profile if trained on prior activity data. When the two platforms report 243 kcal and 930 kcal for the same ride, this speed-only fallback is usually the reason.
What are typical MET values for common cycling activities?
The 2024 Adult Compendium of Physical Activities publishes measured MET values for 44 cycling activity codes. Leisure cycling on flat terrain (10 to 12 mph) sits at roughly 6.8 METs, moderate cycling (12 to 14 mph) at 8.0 METs, vigorous cycling (14 to 16 mph) at 10.0 METs, and racing cycling (greater than 20 mph) at 15.8 METs — with a MET defined as the energy cost of quiet sitting, or approximately 3.5 mL O2/kg/min.
MET-based estimates are the fallback when no power meter or heart-rate strap is available. The equation is simple: energy expenditure (kcal/min) equals MET value times weight in kilograms times 3.5 divided by 200. For a 70 kg rider at 8.0 METs (moderate cycling), that gives about 9.8 kcal/min or 588 kcal per hour — roughly 2,460 kJ per hour in AU units. The 2024 Compendium is the most rigorously measured MET reference published, containing 1,114 activities across 22 major headings, and the walking calorie calculator ACSM uses the same 3.5 mL O2/kg/min MET definition for its walking equations.
MET values for common cycling intensities from the 2024 Adult Compendium, with worked kcal-per-hour estimates for two body weights:
| Activity | Typical speed | MET | kcal/hour, 70 kg | kcal/hour, 85 kg |
|---|---|---|---|---|
| Leisure cycling (level, easy) | 10 to 12 mph | 6.8 | 500 | 607 |
| Moderate cycling | 12 to 14 mph | 8.0 | 588 | 714 |
| Vigorous cycling | 14 to 16 mph | 10.0 | 735 | 893 |
| Racing pace | 16 to 19 mph | 12.0 | 882 | 1,071 |
| Elite racing | greater than 20 mph | 15.8 | 1,161 | 1,411 |
| Stationary, general | 100 to 150 W | 7.0 | 515 | 625 |
A five-step protocol for picking the right cycling calorie method for your ride:
- If you have a power meter, use kilojoules times 1.0 as the working calorie estimate. The 1 kJ approximately 1 kcal shorthand carries roughly plus or minus 10 percent per-ride error for most riders, and the group-level agreement with indirect calorimetry is within 1 percent per the 2013 Haakonssen validation.
- If you only have a chest-strap heart-rate monitor, use the Keytel equation with your age, weight, and gender. Expect 10 to 20 percent individual variability. Match against a rest-day resting metabolic rate estimate — see the calculate TDEE and daily calorie needs guide — to sanity check the total.
- If you have neither, use the 2024 Compendium MET tables at the average intensity you rode. Errors of plus or minus 25 percent are normal but the direction is centred rather than systematically biased.
- Avoid trusting the default speed-only estimate in any consumer app. Strava, Garmin without sensors, and MyFitnessPal's default cycling activity all fall into this category and can miss by 30 to 60 percent on hilly or windy days.
- Do not compensate a single ride's calorie estimate by more than 20 percent when adjusting daily intake. The individual variability in any cycling energy expenditure method is roughly plus or minus 15 percent per session, so treating a 900 kcal ride estimate as literally 900 kcal will systematically over- or under-report your weekly balance.
The TDEE activity multipliers overestimate guide covers why the standard "1.55 moderately active" lifestyle multiplier over-counts cyclists specifically, and why a per-workout add-on with sensor data usually outperforms a lifestyle multiplier for weekly calorie planning. If you want to compare to running-based estimates on the same weekly plan, the walking calorie calculator ACSM uses the same MET framework as a reference point.
Frequently Asked Questions
How accurate is the 1 kJ equals 1 kcal shortcut for cycling?
At the group level, within roughly 1 percent for trained riders per the 2013 Haakonssen indirect-calorimetry validation. Per individual ride, error runs about plus or minus 10 to 15 percent because personal gross metabolic efficiency ranges from 18 to 26 percent across the adult population. Riders with well-trained aerobic systems tend to sit at the more efficient end and burn slightly fewer kilocalories per kilojoule of mechanical work than novices at the same wattage.
Is a heart-rate strap accurate enough without a power meter?
For steady-state rides at moderate intensity, yes — the Keytel 2005 equation reaches R values above 0.91 against indirect calorimetry. Individual error of 10 to 20 percent is normal, and rises during sprints and heat. Chest-strap devices outperform wrist-worn optical heart-rate for cycling because vibration and hand position degrade the wrist-optical signal, a limitation summarised in the wearables and nutrition tracking guide.
Why do Strava and Garmin show different calorie numbers for the same ride?
Because they use different default algorithms when no power meter is paired. Strava's non-power estimate relies on speed, weight, and gradient inputs against a fixed drag assumption; Garmin's blends heart-rate data and Firstbeat physiological modelling. Real-world discrepancies of 200 to 900 kcal on the same file are documented in rider forums and typically resolve when both platforms see the same power meter data.
Does cadence affect cycling calorie estimates?
Yes. The 2015 Formenti study showed that the standard ACSM cycle ergometer equation, which ignores pedaling rate, carried a bias of 3.2 mL O2/kg/min against measured VO2 at high cadences. Internal work — the metabolic cost of moving the limbs themselves — scales approximately with cadence cubed, so 100 rpm burns meaningfully more than 70 rpm at the same external wattage. Most power-meter-based energy expenditure calculations do capture this because they read total mechanical work regardless of how the rider produced it.
Can I use MET values from the 2024 Compendium to plan calorie targets?
Yes, as a rough estimate. Multiply the MET value by your weight in kilograms, by 3.5, and divide by 200 to get kilocalories per minute. Expect roughly plus or minus 25 percent per-workout error compared with power-meter data, but the average across many rides converges toward the reference. This is the fallback the best calorie tracking apps comparison recommends for apps that do not read power files.
Does e-bike assistance change the calorie calculation?
Yes, substantially. E-bike riding at pedal-assist level 1 typically burns 30 to 50 percent of the calories of unassisted cycling at the same speed. Published systematic reviews find that e-bike commuting still elevates energy expenditure meaningfully above driving or transit and produces measurable cardiorespiratory benefits, but at roughly half the metabolic cost of a conventional bike on the same route.
Sources
- Keytel LR, Goedecke JH, Noakes TD, et al. Prediction of energy expenditure from heart rate monitoring during submaximal exercise. Journal of Sports Sciences. 2005. https://pubmed.ncbi.nlm.nih.gov/15966347/
- Haakonssen EC, Martin DT, Burke LM, Jenkins DG. Energy expenditure of constant- and variable-intensity cycling: power meter estimates. Medicine and Science in Sports and Exercise. 2013;45(9):1833-1840. https://pubmed.ncbi.nlm.nih.gov/23470312/
- Klass M, Faoro V, Carpentier A. Assessment of energy expenditure during high intensity cycling and running using a heart rate and activity monitor in young active adults. PLoS ONE. 2019;14(11):e0224948. https://pmc.ncbi.nlm.nih.gov/articles/PMC6837421/
- Bouillod A, Pinot J, Soto-Romero G, Bertucci W, Grappe F. Caveats and Recommendations to Assess the Validity and Reliability of Cycling Power Meters: A Systematic Scoping Review. Sensors. 2022. https://pmc.ncbi.nlm.nih.gov/articles/PMC8749704/
- Herrmann SD, Willis EA, Ainsworth BE, et al. 2024 Adult Compendium of Physical Activities: A third update of the energy costs of human activities. Journal of Sport and Health Science. 2024;13(1):6-12. https://pmc.ncbi.nlm.nih.gov/articles/PMC10818145/
- Formenti F, Minetti AE, Borrani F. Pedaling rate is an important determinant of human oxygen uptake during exercise on the cycle ergometer. Physiological Reports. 2015. https://pmc.ncbi.nlm.nih.gov/articles/PMC4600374/
Ready to track smarter?
Join thousands who use kcalm for calorie tracking. AI-powered food recognition, scientifically-validated calculations, and zero anxiety.
Related Articles
Afterburn Effect: How Many Extra Calories Does EPOC Burn?
Explore the afterburn effect with measured EPOC calories, kcal and kJ comparisons, research limitations and practical advice for your calorie log.
ScienceSauna Calories Burned: What the Studies Really Measure
Explore sauna calories burned, what heat studies actually measured, why water loss differs from fat loss and how to handle uncertain numbers in your food log.
ScienceFood Scale vs Measuring Cups: Portion Errors Explained
Compare food scales, measuring cups and eyeballing using portion-size research, practical logging steps and worked calorie examples in kcal and kilojoules.