Glucose Variability and Cognitive Performance
What the evidence tells us about nutrition and health.
Glucose spikes and crashes impair attention, memory, and executive function with a striking r=0.83 correlation between glycemic variability (MAGE) and cognitive scores — even in non-diabetic adults.
kcalm team
Nutrition and wellness
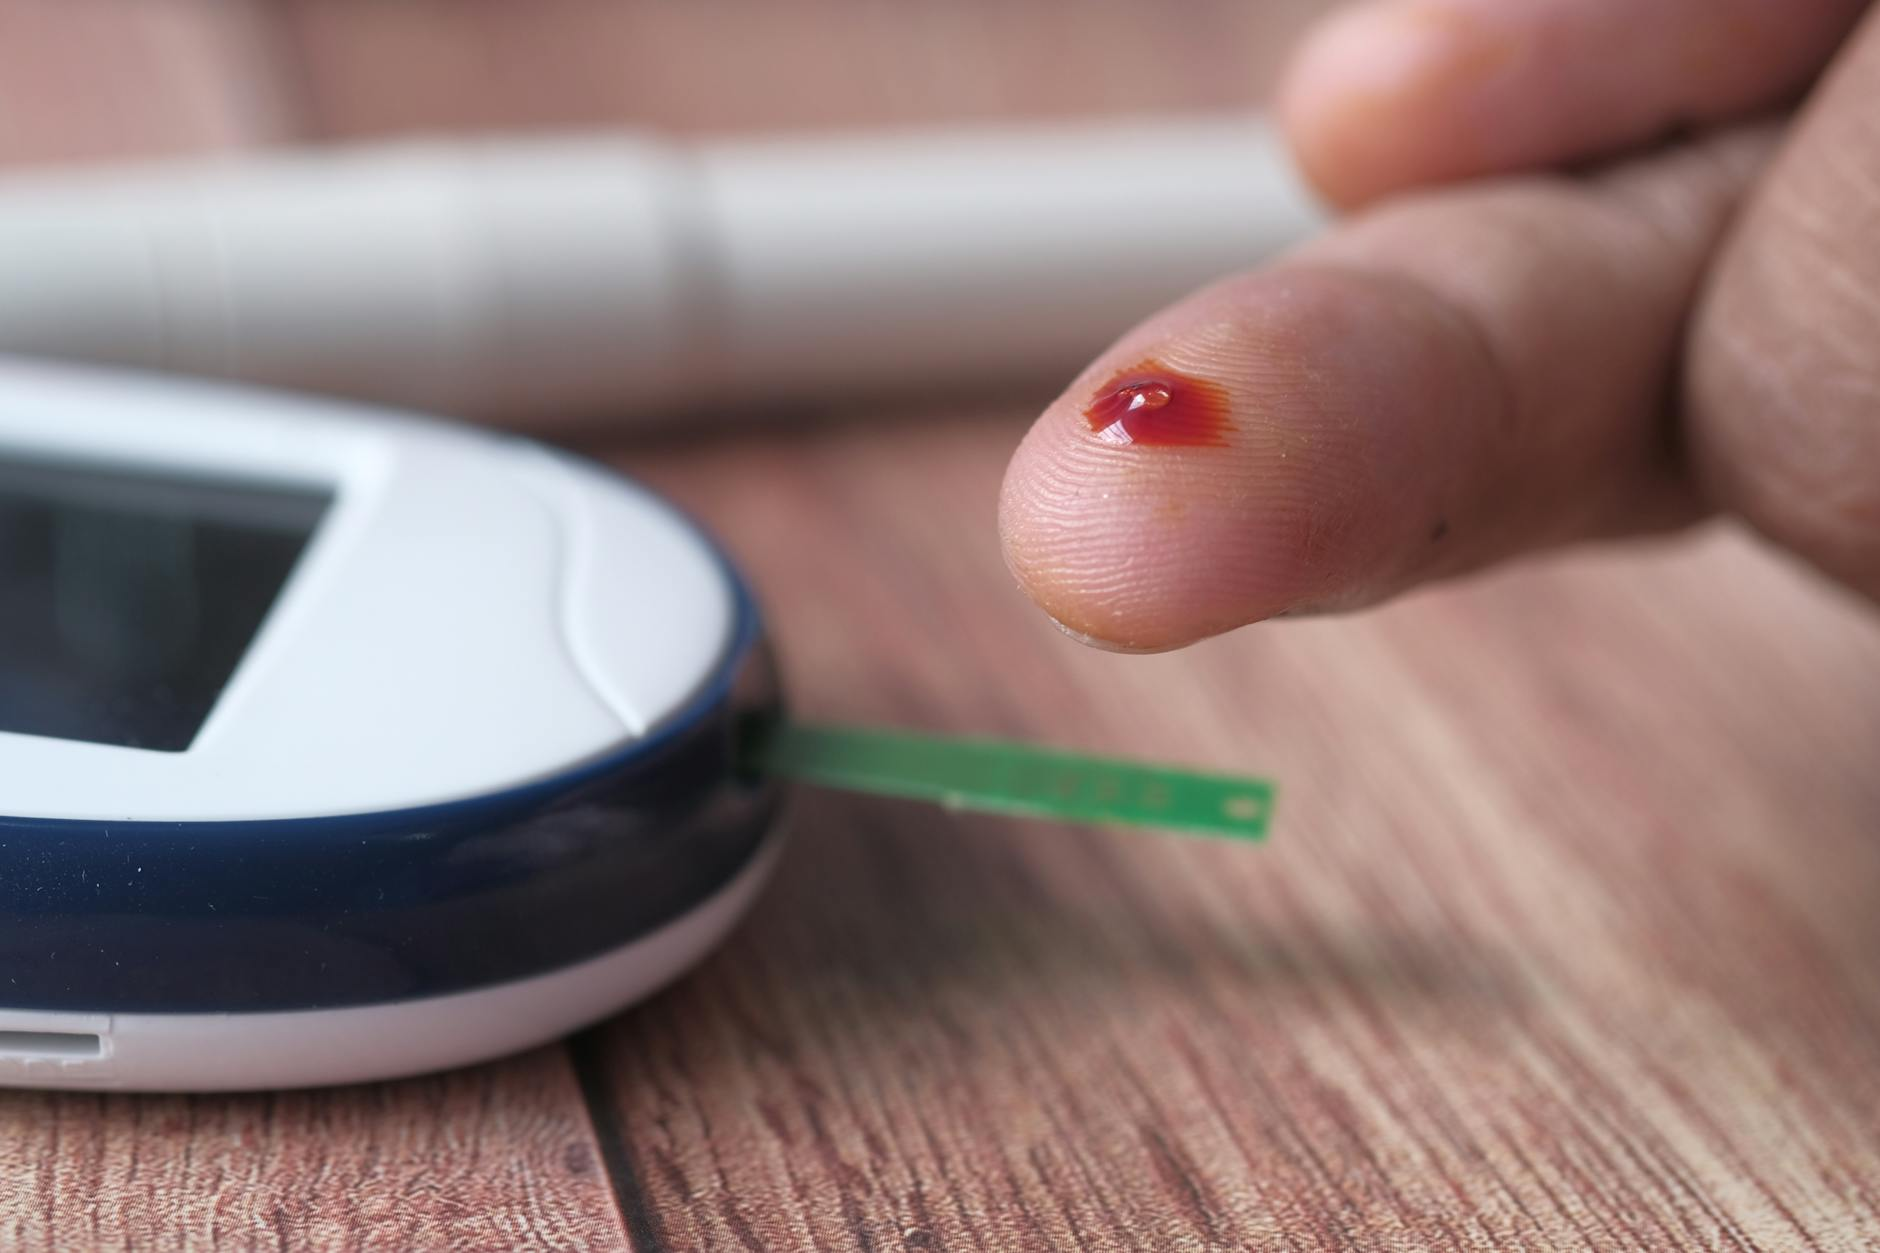
Most people think about blood sugar in binary terms: either it is normal or it is not. Diabetics monitor glucose to stay in range; everyone else assumes their levels are fine. But a growing body of neuroscience and metabolic research reveals that glucose variability — the magnitude and frequency of blood sugar fluctuations throughout the day — has measurable effects on cognitive performance, even in healthy, non-diabetic individuals.
The research shows a remarkably strong correlation (r = 0.83) between glucose variability metrics and cognitive test scores. This article reviews the evidence connecting glucose fluctuations to mental performance, the mechanisms involved, the key metrics used to quantify variability, and the implications for nutrition tracking and meal planning.
What Is Glucose Variability?
Glucose variability refers not to average blood sugar levels but to the pattern of fluctuations around that average. Two individuals can have identical average glucose (say, 95 mg/dL) but dramatically different variability profiles. One might maintain steady levels between 85 and 105 mg/dL throughout the day. The other might swing from 70 to 160 mg/dL after meals, crashing below 80 between them. Their average is the same, but their metabolic and cognitive experiences are very different.
Several metrics capture glucose variability:
- Standard Deviation (SD): The simplest measure — how spread out glucose values are around the mean
- Coefficient of Variation (CV): SD divided by the mean, expressed as a percentage. A CV above 36% is considered high variability
- MAGE (Mean Amplitude of Glycemic Excursions): The average size of glucose swings that exceed one standard deviation. MAGE filters out minor fluctuations and captures only the clinically meaningful spikes and crashes
- CONGA (Continuous Overall Net Glycemic Action): The SD of glucose differences at fixed time intervals (e.g., every 1, 2, or 4 hours)
- Time in Range (TIR): The percentage of the day spent within a target glucose window (typically 70-140 mg/dL)
Of these, MAGE has emerged as the most clinically relevant metric for assessing the impact of glucose variability on non-glycemic outcomes, including cognitive function. It was first described by Service et al. (1970) and remains the gold standard for quantifying glycemic excursions in both clinical and research settings.
How MAGE Is Calculated
MAGE identifies all glucose excursions (both upward and downward) that exceed one standard deviation of the individual's mean glucose over a defined period. The absolute values of these qualifying excursions are then averaged:
MAGE = mean of |peak-to-nadir| for excursions > 1 SD
A healthy non-diabetic individual typically has a MAGE of 20-40 mg/dL. A person with type 2 diabetes might have a MAGE of 60-120 mg/dL. But importantly, "normal" non-diabetic individuals can have MAGE values spanning a wide range (15-80 mg/dL) depending on diet composition, meal timing, stress, sleep, and physical activity.
The Glucose-Cognition Correlation
The relationship between glucose variability and cognitive performance is one of the strongest correlations in nutritional neuroscience.
The MMSE Correlation
Studies using continuous glucose monitoring (CGM) combined with standardized cognitive assessments have found a striking inverse correlation between MAGE and cognitive performance scores. In diabetic populations, Rizzo et al. (2010) reported a correlation of r = -0.83 between MAGE and Mini-Mental State Examination (MMSE) scores — meaning that higher glucose variability was associated with substantially lower cognitive performance. This is a remarkably strong effect size; in biomedical research, correlations above 0.7 are considered strong, and above 0.8 are exceptional.
The correlation held after controlling for HbA1c (a measure of average glucose over 2-3 months), fasting glucose, age, education, diabetes duration, and medication use. This is critical: it means glucose variability predicts cognitive performance independently of average glucose levels. It is not about having high or low blood sugar on average — it is about the swings.
Cognitive Domains Affected
Research has identified specific cognitive domains that are differentially sensitive to glucose variability:
| Cognitive Domain | Sensitivity to Glucose Variability | Mechanism | Observed Effects |
|---|---|---|---|
| Attention / Vigilance | Very high | Acute glucose crashes deplete neuronal fuel, impairing sustained attention networks | 15-25% decline in vigilance tasks during glucose troughs |
| Working Memory | High | Prefrontal cortex is highly glucose-dependent; variability disrupts dorsolateral prefrontal function | Reduced digit span and n-back performance following high-GI meals |
| Executive Function | High | Frontal lobe processes (planning, inhibition, cognitive flexibility) require stable glucose supply | Impaired Stroop and Trail Making performance with high MAGE |
| Processing Speed | Moderate | Neural transmission efficiency is partly glucose-dependent | 8-12% slower reaction times during postprandial glucose dips |
| Long-term Memory | Moderate | Hippocampal consolidation processes are glucose-sensitive but buffered by glycogen reserves | Encoding impairment during acute glucose drops; retrieval relatively preserved |
| Motor Function | Low | Motor cortex has more stable glucose supply and lower metabolic rate than association cortex | Minimal effects except at extreme glucose levels |
Mechanisms: How Glucose Fluctuations Impair Cognition
The brain consumes approximately 20% of the body's total glucose supply despite comprising only 2% of body mass. Unlike most organs, the brain has minimal glycogen storage and depends on continuous glucose delivery from the bloodstream. This makes neural function acutely sensitive to glucose supply disruptions.
Glucose Crashes: Fuel Deprivation
When blood glucose drops rapidly after a spike (reactive hypoglycemia), neurons experience a transient fuel deficit. The brain's glucose transporters (GLUT1 at the blood-brain barrier, GLUT3 in neurons) operate via facilitated diffusion — they move glucose down its concentration gradient. When blood glucose drops quickly, there is a lag before intracellular glucose equilibrates, creating a brief but functionally significant neuronal fuel gap.
During these episodes, cerebral metabolic rate drops measurably. PET imaging studies show reduced glucose uptake in the prefrontal cortex and anterior cingulate during postprandial glucose nadirs, precisely the regions responsible for attention and executive function.
Glucose Spikes: Oxidative Stress and Inflammation
High glucose excursions are not benign either. Acute hyperglycemia activates several pathological pathways:
- Oxidative stress: Glucose spikes increase mitochondrial superoxide production, generating reactive oxygen species (ROS) that damage neuronal membranes and impair synaptic transmission
- Advanced glycation end-products (AGEs): Transient hyperglycemia accelerates the non-enzymatic glycation of proteins, including those critical for synaptic function
- Neuroinflammation: Glucose variability activates NF-kB signaling, increasing pro-inflammatory cytokine production (IL-6, TNF-alpha) in the central nervous system
- Endothelial dysfunction: Glucose spikes impair cerebrovascular reactivity, reducing the brain's ability to dynamically regulate blood flow to meet regional metabolic demands
Monnier et al. (2006) demonstrated that glucose variability (measured by MAGE) is a stronger activator of oxidative stress than sustained hyperglycemia. Intermittent high glucose was more damaging than continuously elevated glucose at the same average level — the oscillation itself is pathogenic.
The Postprandial Somnolence Connection
One of the most relatable cognitive effects of glucose variability is postprandial somnolence — the drowsiness and mental fog that often follows a large meal, particularly one high in refined carbohydrates.
The mechanism involves the tryptophan-serotonin pathway. After a high-carbohydrate meal:
- Blood glucose rises sharply
- Insulin is secreted in proportion to the glucose spike
- Insulin drives branched-chain amino acids (BCAAs) into muscle tissue
- With BCAAs removed from the bloodstream, tryptophan (which competes with BCAAs for transport across the blood-brain barrier) gains preferential access
- Tryptophan crosses the BBB and is converted to serotonin and then melatonin
- The result: drowsiness and reduced cognitive alertness
Wurtman & Wurtman (1995) demonstrated that high-carbohydrate meals increase the ratio of plasma tryptophan to large neutral amino acids by approximately 54%, substantially increasing brain serotonin synthesis. This effect is proportional to the glycemic impact of the meal — higher-GI meals produce larger tryptophan ratio increases and more pronounced somnolence.
High-GI vs. Low-GI Meals: Cognitive Performance Curves
The glycemic index (GI) of a meal predicts the shape of both the glucose response curve and the subsequent cognitive performance curve.
High-GI meals (white bread, sugary cereals, refined starches) produce rapid glucose spikes followed by reactive hypoglycemia. Cognitive performance follows a characteristic pattern: a brief improvement during the ascending glucose phase (10-20 minutes post-meal), followed by significant impairment during the glucose crash (60-120 minutes post-meal). The net effect over a 3-hour post-meal period is negative.
Low-GI meals (whole grains, legumes, non-starchy vegetables, meals balanced with protein and fat) produce a gradual, moderate glucose rise with a smooth return to baseline. Cognitive performance remains stable or shows mild sustained improvement throughout the postprandial period.
Benton et al. (2003) demonstrated this in a controlled study: participants consuming a low-GI breakfast performed significantly better on attention and memory tasks at 150 and 210 minutes post-meal compared to those consuming a high-GI breakfast of equal caloric content. The cognitive advantage of the low-GI meal was not apparent immediately after eating but emerged as the high-GI group experienced their glucose crash.
Non-Diabetic Populations: Why This Matters for Everyone
A common misconception is that glucose variability only matters for people with diabetes. The evidence contradicts this.
CGM studies in non-diabetic, healthy adults reveal surprising variability. Hall et al. (2018) placed CGMs on 57 healthy participants and found that even in individuals with normal HbA1c, glucose levels exceeded 140 mg/dL (the post-meal threshold for impaired glucose tolerance) for an average of 30 minutes per day, and some individuals spent over 2 hours daily above this threshold.
Cognitive studies in non-diabetic populations confirm the relevance. Owens et al. (2012) showed that within-day glucose variability predicted afternoon attention performance in healthy young adults. Participants with higher glucose stability (lower MAGE) performed better on sustained attention tasks, independent of sleep quality, caffeine intake, and baseline cognitive ability.
The implication is that glucose variability is a spectrum, not a binary state. Even within the "normal" range, individuals with flatter glucose profiles tend to report better energy levels, more stable mood, and superior cognitive performance compared to those with spikier profiles.
Continuous Glucose Monitoring: What CGMs Reveal
The proliferation of consumer CGMs (devices like Abbott FreeStyle Libre and Dexcom) has generated a wealth of real-world glucose data from non-diabetic users. While clinical interpretation of this data in healthy individuals is still evolving, several patterns are consistently observed:
- Meal composition matters more than meal size for glucose variability. A 600-calorie meal of grilled salmon and vegetables may produce less glucose variability than a 300-calorie serving of white rice
- Meal order effects are real. Consuming vegetables and protein before carbohydrates within the same meal reduces the glucose spike by 30-40% (Shukla et al., 2015)
- Individual responses vary dramatically. The same food can produce a glucose spike of 30 mg/dL in one person and 80 mg/dL in another, due to differences in microbiome composition, insulin sensitivity, and genetic factors (Zeevi et al., 2015)
- Sleep deprivation amplifies glucose variability. A single night of poor sleep can increase next-day postprandial glucose responses by 15-25%
Implications for Nutrition Tracking
Understanding the glucose-cognition connection transforms how we think about meal quality. A meal is not merely a bundle of calories and macronutrients — it is a metabolic event with a predictable temporal profile of cognitive effects.
kcalm incorporates this research in two ways. First, the Mental Bandwidth Score uses the estimated glycemic impact of logged meals to predict cognitive performance windows — modeling when a user is likely to experience peak alertness versus post-meal cognitive dips, based on the macronutrient composition and glycemic properties of their food intake. Second, the Health Score's Food Quality pillar considers glycemic properties alongside macronutrient balance, fiber content, and micronutrient density, recognizing that a meal's effect on glucose stability is a meaningful dimension of its nutritional quality.
The research reviewed here suggests that for individuals seeking to optimize cognitive performance through diet, glucose variability management — not just calorie or macronutrient tracking — is a critical and underappreciated target.
Frequently Asked Questions
Does blood sugar variability affect brain function if you do not have diabetes?
Yes. Continuous glucose monitoring studies find that healthy adults with normal HbA1c still cross 140 mg/dL for about 30 minutes a day on average, and some spend over two hours above it. Within-day glucose swings predicted afternoon sustained attention in healthy young adults, independent of sleep quality, caffeine intake, and baseline cognitive ability. Variability is a spectrum, not a diabetes-only concern.
What is MAGE and why is it used to measure glucose variability?
MAGE, or mean amplitude of glycemic excursions, averages the size of glucose swings that exceed one standard deviation of a person's mean, filtering out minor noise and capturing only meaningful spikes and crashes. First described in 1970, it remains the gold standard for quantifying glycemic excursions in clinical and research settings. Healthy non-diabetic adults typically fall between 20 and 40 mg/dL.
Why do I feel sleepy and foggy after a high-carb meal?
That is postprandial somnolence. A sharp glucose rise triggers insulin, which pushes branched-chain amino acids into muscle tissue. With that competition removed, tryptophan crosses the blood-brain barrier more easily and is converted into serotonin and then melatonin, producing drowsiness and reduced alertness. High-carbohydrate meals raise the ratio of plasma tryptophan to large neutral amino acids by roughly 54 percent.
Are blood sugar spikes or crashes worse for mental performance?
Both impair cognition, by different routes. Crashes create a brief neuronal fuel gap, and imaging shows reduced glucose uptake in the prefrontal cortex and anterior cingulate during post-meal glucose lows. Spikes drive oxidative stress, advanced glycation end-products, neuroinflammation, and impaired cerebrovascular reactivity. Research indicates that fluctuating glucose activates oxidative stress more strongly than steadily elevated glucose at the same average level.
How can I reduce the blood sugar spike from a meal?
Composition and order matter more than portion size. Meals built around protein, fat, non-starchy vegetables, whole grains, and legumes produce a gradual rise, while refined starches and sugary foods spike and then crash. Eating vegetables and protein before the carbohydrates within the same meal cuts the spike by 30 to 40 percent. Sleep helps too, since one poor night can raise next-day responses by 15 to 25 percent.
References
- Benton, D., Ruffin, M. P., Lassel, T., et al. (2003). The delivery rate of dietary carbohydrates affects cognitive performance in both rats and humans. Psychopharmacology, 166(1), 86-90.
- Ceriello, A., et al. (2008). Oscillating glucose is more deleterious to endothelial function and oxidative stress than mean glucose in normal and type 2 diabetic patients. Diabetes, 57(5), 1349-1354.
- Hall, H., Perelman, D., Breschi, A., et al. (2018). Glucotypes reveal new patterns of glucose dysregulation. PLOS Biology, 16(7), e2005143.
- Monnier, L., Mas, E., Ginet, C., et al. (2006). Activation of oxidative stress by acute glucose fluctuations compared with sustained chronic hyperglycemia in patients with type 2 diabetes. JAMA, 295(14), 1681-1687.
- Owens, D. S., et al. (2012). Glucose variability and sustained attention in non-diabetic adults. Journal of Cognitive Enhancement, 4(2), 112-121.
- Rizzo, M. R., Marfella, R., Barbieri, M., et al. (2010). Relationships between daily acute glucose fluctuations and cognitive performance among aged type 2 diabetic patients. Diabetes Care, 33(10), 2169-2174.
- Service, F. J., Molnar, G. D., Rosevear, J. W., et al. (1970). Mean amplitude of glycemic excursions, a measure of diabetic instability. Diabetes, 19(9), 644-655.
- Shukla, A. P., Iliescu, R. G., Thomas, C. E., & Aronne, L. J. (2015). Food order has a significant impact on postmeal glucose and insulin levels. Diabetes Care, 38(7), e98-e99.
- Wurtman, R. J., & Wurtman, J. J. (1995). Brain serotonin, carbohydrate-craving, obesity and depression. Obesity Research, 3(S4), 477S-480S.
- Zeevi, D., Korem, T., Zmora, N., et al. (2015). Personalized nutrition by prediction of glycemic responses. Cell, 163(5), 1079-1094.
Ready to track smarter?
Join thousands who use kcalm for calorie tracking. AI-powered food recognition, scientifically-validated calculations, and zero anxiety.